At the beginning of 2019 I wrote a blog post about taking backups from Azure disks attached to an Azure Kubernetes Service cluster.
-> https://www.danielstechblog.io/taking-backups-from-azure-disks-attached-to-aks-via-azure-automation/
Since then, some things changed. Azure Function PowerShell support went into public preview in April 2019 and the AzTable (AzureRmStorageTable) module I use in the solution had new releases.
So, I decided it is the right timing to overhaul and rewrite the implementation.
Here we are and I like to walk you through the new solution. But let us step back why you need such a solution.
When you use dynamically created Azure disks via Kubernetes PVC (Persistent Volume Claim) in AKS the documentation mentions as backup option snapshots.
-> https://docs.microsoft.com/en-us/azure/aks/azure-disks-dynamic-pv#back-up-a-persistent-volume
As you properly will not do it manually a solution that automates this would be nice. Especially looking at options like retention time and automatic cleanup functionality.
That is what I tried to accomplish with my implementation. It does not matter if the Azure disk got dynamically or statically/manually created. As long as they are tagged correctly.
Before we dive into the solution and its deployment let us have a look at the table for the differences between v1 and v2.
| v1 | v2 | |
| Infrastructure setup |
|
|
| Solution |
|
|
| Azure disk onboarding |
|
|
The deployment of the necessary Azure resources is an Azure CLI one-liner. You only need to replace the parameter values.
### OPTION 1 ###
> az deployment sub create --name "setup-aks-snapshot-backup" --location "westeurope" \
  --template-uri https://raw.githubusercontent.com/neumanndaniel/armtemplates/master/aks-snapshot-backup/aks-snapshot-backup.json \
  --parameters \
  resourceGroupName='aks-snapshot-backup-infrastructure' \
  location='westeurope' \
  functionName='aks-snapshot-backup' \
  timeZone='W. Europe Standard Time' \
  --verbose
### OPTION 2 ###
> az deployment sub create --name "setup-aks-snapshot-backup" --location "westeurope" \
  --template-uri https://raw.githubusercontent.com/neumanndaniel/armtemplates/master/aks-snapshot-backup/aks-snapshot-backup.json \
  --parameters \
  resourceGroupName='aks-snapshot-backup-infrastructure' \
  location='westeurope' \
  functionName='aks-snapshot-backup' \
  timeZone='W. Europe Standard Time' \
  operatorRoleDefinitionGuid='e6dec0ce-6745-4c05-ae5c-903faf38a590' \
  operatorRoleAssignmentGuid='5a34bfc2-f4a8-4ad9-b73a-ac22e7fb74ff' \
  contributorRoleDefinitionGuid='b02a5d6d-e3f3-4530-b768-e384d10c6100' \
  contributorRoleAssignmentGuid='85ac478a-a2aa-4714-9222-39a6492a6305' \
  storageContributorRoleAssignmentGuid='f34a3ad5-37c9-4e39-a33c-7218ac852c69' \
  --verbose
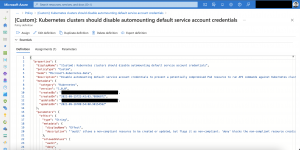
What gets deployed into your subscription?
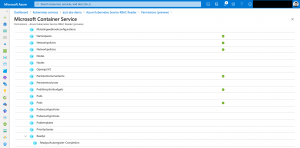
The main Azure Resource Manager template creates a resource group and two custom roles for Azure RBAC.
These custom roles called AKS Snapshot Backup Contributor and Operator. Only necessary actions are defined.
| AKS Snapshot Backup Contributor | AKS Snapshot Backup Operator | |
| Actions |
|
|
| Scope |
|
|
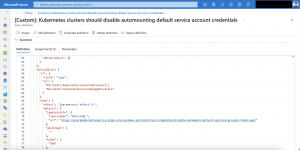
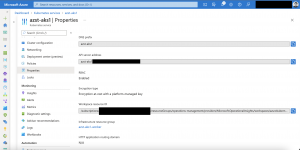
All the required Azure resource are deployed via the first linked template. Our Azure Table storage gets tagged with the key value pair aksSnapshotBackupDatabase:tableStorage.
So, the Azure Function can find its backend storage storing necessary information about the taken snapshots.
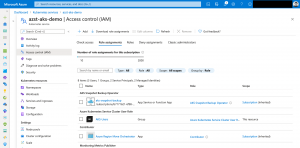
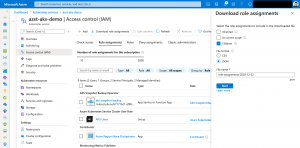
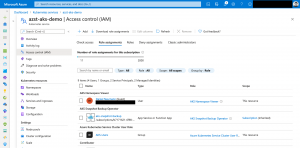
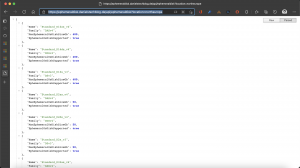
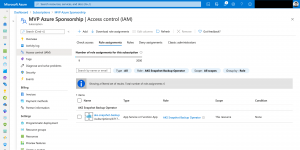
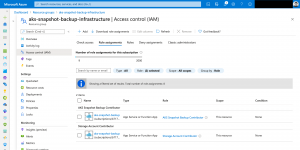
For the pending role assignments, the linked template returns the principal id of the function’s managed identity.
Three role assignments need to be set. One on subscription level via the main template and two on resource group level via the second linked template.
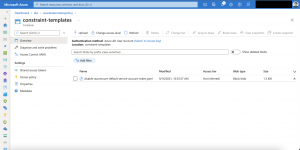
Azure Function upload
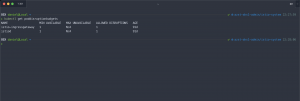
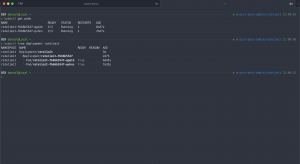
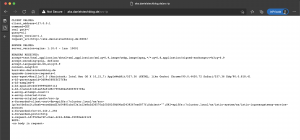
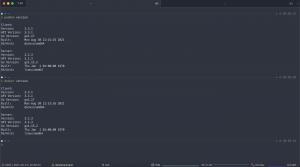
Afterwards we upload the PowerShell function with the Azure Function Core Tools.
-> https://github.com/neumanndaniel/serverless/tree/master/aks-snapshot-backup
> func azure functionapp publish aks-snapshot-backup
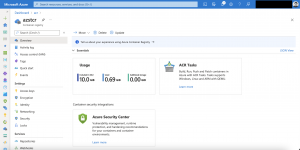
The Function App itself consists of two functions. One for taking snapshots and the other one for deleting snapshots that are older than the specified retention time.
Default schedules for the execution are midnight for taking snapshots and 2am in the morning for the cleanup. But that is only valid, if you specified the correct time zone during the ARM template deployment.
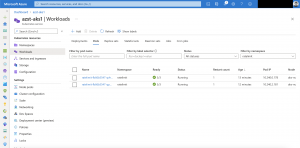
Azure disk onboarding
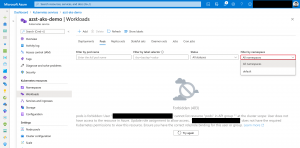
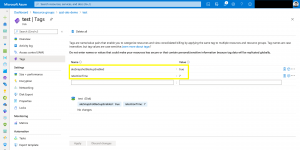
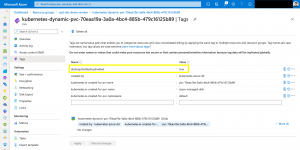
Specifying which Azure disks should have a backup is easy and done using tags.
Set the key value pair aksSnapshotBackupEnabled:true and the disk is onboarded to the process. You can specify with the tag retentionTime:7 a custom retention time in days. If the tag is not set a default of 3 days applies.
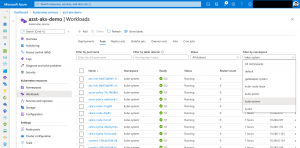
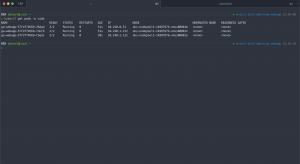
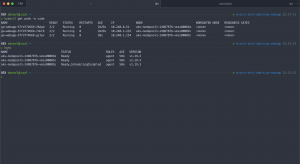
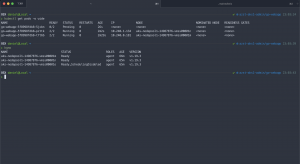
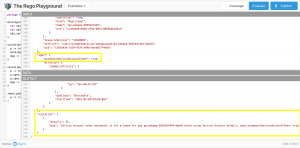
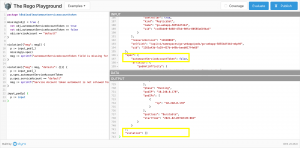
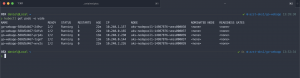
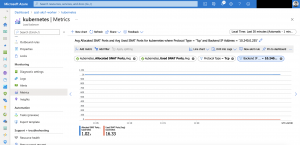
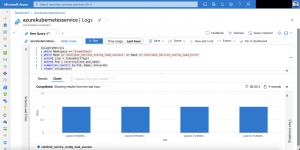
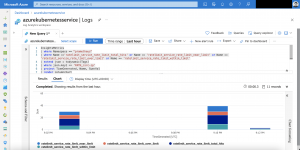
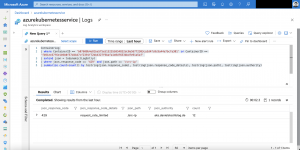
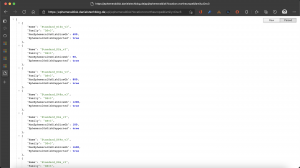
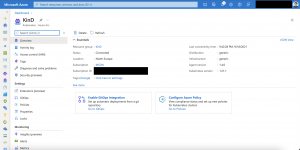
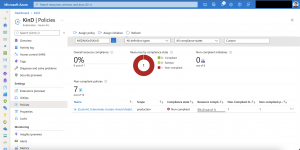
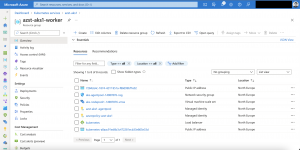
After the first run you should see the snapshot in the solutions resource group and an entry for it in the Azure Table storage.
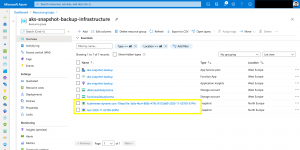
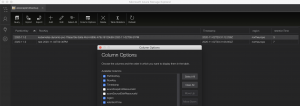
The naming pattern for the snapshot follows the schema {AZURE_DISK_NAME}-%Y-%m-%dT%I-%M%p. In the automatically created table akssnapshotbackup the following information are stored.
| Column | Description |
| PartitionKey | Date format e.g., 2020-11-2 |
| RowKey | Snapshot name |
| Timestamp | Automatically created when adding the entry |
| azureSnapshotResourceId | Resource id of the snapshot |
| azureSourceDiskResourceId | Resource id of the Azure disk |
| region | Azure region |
| retentionTime | Days to retain the snapshot |
The cleanup process removes the snapshot and the table entry when the lifetime expires.
You find the ARM templates and the PowerShell function in my GitHub repositories.
-> https://github.com/neumanndaniel/armtemplates/tree/master/aks-snapshot-backup
-> https://github.com/neumanndaniel/serverless/tree/master/aks-snapshot-backup
Der Beitrag Automate taking backups from Azure disks attached to Azure Kubernetes Service erschien zuerst auf Daniel's Tech Blog.