Quantcast
Channel: Backoffice – Daniel's Tech Blog
Viewing all 181 articles
Browse latest View live

Run the Istio ingress gateway with TLS termination and TLS passthrough

$
0
0

The Istio ingress gateway supports two modes for dealing with TLS traffic: TLS termination and TLS passthrough.

Running Istio with TLS termination is the default and standard configuration for most installations. Incoming TLS traffic is terminated at the Istio ingress gateway level and then sent to the destination service encrypted via mTLS within the service mesh.

Having the TLS passthrough configured the Istio ingress gateway passing through the TLS traffic directly to the destination service which then does the TLS termination.

Are both modes supported at the same time with the default ingress gateway configuration?

Sure, and that is today’s topic in this blog post.

Configuration – Istio ingress gateway

Our starting point is a standard Istio installation and ingress gateway configuration doing the TLS termination on port 443 for our wildcard domain configuration.

apiVersion: install.istio.io/v1alpha1
kind: IstioOperator
metadata:
  namespace: istio-system
  name: istiocontrolplane
spec:
  components:
    base:
      enabled: true
    cni:
      enabled: true
    ingressGateways:
      - enabled: true
        name: istio-ingressgateway
        k8s:
          hpaSpec:
            minReplicas: 2
          overlays:
            - apiVersion: v1
              kind: Service
              name: istio-ingressgateway
              patches:
                - path: spec.ports
                  value:
                    - name: status-port
                      port: 15021
                      targetPort: 15021
                      protocol: TCP
                    - name: http2
                      port: 80
                      targetPort: 8080
                      protocol: TCP
                    - name: https
                      port: 443
                      targetPort: 8443
                      protocol: TCP
    pilot:
      enabled: true
      k8s:
        hpaSpec:
          minReplicas: 2
  meshConfig:
    accessLogFile: "/dev/stdout"
    accessLogEncoding: "JSON"
  values:
    global:
      istiod:
        enableAnalysis: true
    cni:
      excludeNamespaces:
        - istio-system
        - kube-system
    pilot:
      env:
        PILOT_ENABLE_STATUS: true
    sidecarInjectorWebhook:
      rewriteAppHTTPProbe: true
apiVersion: networking.istio.io/v1beta1
kind: Gateway
metadata:
  name: azst-aks-gateway
  namespace: istio-config
spec:
  selector:
    istio: ingressgateway # use Istio default gateway implementation
  servers:
    - hosts:
        - "*.danielstechblog.de"
      port:
        number: 80
        name: http
        protocol: HTTP
      tls:
        httpsRedirect: true
    - hosts:
        - "*.danielstechblog.de"
      port:
        number: 443
        name: https
        protocol: HTTPS
      tls:
        mode: SIMPLE
        credentialName: istio-ingress-cert

Besides that, we want to have a dedicated port on the Istio ingress gateway for TLS traffic which is passed through the destination service.

The first step onto that path is the adjustment of the Istio configuration itself adding another port mapping on the HTTPS port 8443.

apiVersion: install.istio.io/v1alpha1
kind: IstioOperator
metadata:
  namespace: istio-system
  name: istiocontrolplane
spec:
  ...
    ingressGateways:
      - enabled: true
        name: istio-ingressgateway
        k8s:
          hpaSpec:
            minReplicas: 2
          overlays:
            - apiVersion: v1
              kind: Service
              name: istio-ingressgateway
              patches:
                - path: spec.ports
                  value:
                    - name: status-port
                      port: 15021
                      targetPort: 15021
                      protocol: TCP
                    - name: http2
                      port: 80
                      targetPort: 8080
                      protocol: TCP
                    - name: https
                      port: 443
                      targetPort: 8443
                      protocol: TCP
                    - name: tls-passthrough
                      port: 10443
                      targetPort: 8443
                      protocol: TCP
...

After rolling out this change we take the next configuration step adjusting the Istio gateway configuration.

apiVersion: networking.istio.io/v1beta1
kind: Gateway
metadata:
  name: azst-aks-gateway
  namespace: istio-config
spec:
  selector:
    istio: ingressgateway # use Istio default gateway implementation
  servers:
    - hosts:
        - "*.danielstechblog.de"
      port:
        number: 80
        name: http
        protocol: HTTP
      tls:
        httpsRedirect: true
    - hosts:
        - "*.danielstechblog.de"
      port:
        number: 443
        name: https
        protocol: HTTPS
      tls:
        mode: SIMPLE
        credentialName: istio-ingress-cert
    - hosts:
        - "*.tls.danielstechblog.de"
      port:
        number: 10443
        name: tls-passthrough
        protocol: TLS
      tls:
        mode: PASSTHROUGH

An important note here regarding the hosts parameter, you shall not use the same wildcard domain configuration as for your TLS Termination. Either use a wildcard subdomain or a full FQDN configuration.

If you want TLS termination and TLS passthrough on port 443 at the same time, you must configure the hosts parameter with full FQDNs instead of using a wildcard domain configuration. Same counts towards for the virtual services configuration then.

The Istio ingress gateway itself is instructed by the protocol and tls mode parameters whether it does or does not TLS termination. If set to TLS and PASSTHROUGH, as in our case, the ingress gateway passes through the TLS traffic to the destination service.

Configuration – Istio virtual service

Now everything is prepared moving onto the Istio virtual service configuration routing the traffic to our service, which is the NGINX example from the Istio docs.

-> https://istio.io/latest/docs/tasks/traffic-management/ingress/ingress-sni-passthrough/

apiVersion: networking.istio.io/v1beta1
kind: VirtualService
metadata:
  name: nginx
  namespace: istio-config
spec:
  hosts:
    - nginx.tls.danielstechblog.de
  gateways:
    - azst-aks-gateway
  tls:
    - match:
        - port: 10443
          sniHosts:
            - nginx.tls.danielstechblog.de
      route:
        - destination:
            host: my-nginx.nginx.svc.cluster.local
            port:
              number: 443

Instead of configuring an http match we are going to configure a tls match for the virtual service. The tls match requires the port and sniHosts parameter. In our case the port is 10443 and the sniHosts our FQDN.

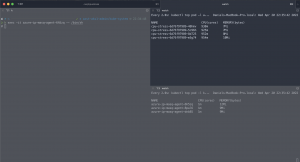
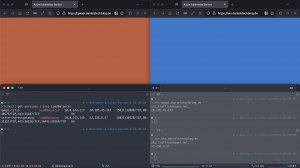
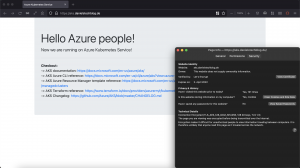
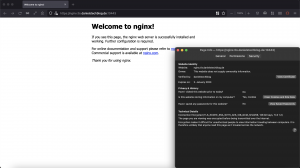
After rolling out the virtual service configuration we call the NGINX service. For comparison I deployed an additional small web service written in go showing the standard TLS termination.

As seen in the screenshot below the certificate used by the Istio ingress gateway is issued by Let’s Encrypt

TLS termination

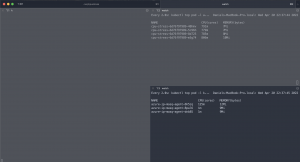
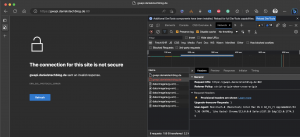
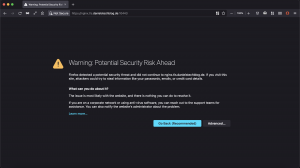
For the TLS passthrough example a self-signed certificate was generated. Those self-signed certificates are marked as unsecure as seen below.

TLS passthrough 01 TLS passthrough 02

Summary

Depending on what configuration you would like to use you can have TLS termination and TLS passthrough on port 443 which requires FQDNs instead of a wildcard domain configuration. The latter one must use another port mapping when you want to have TLS passthrough beside the default TLS termination on port 443 with a wildcard domain configuration.

The sample templates can be found on my GitHub repository.

-> https://github.com/neumanndaniel/kubernetes/tree/master/istio-tls-passthrough

Der Beitrag Run the Istio ingress gateway with TLS termination and TLS passthrough erschien zuerst auf Daniel's Tech Blog.


Running gVisor on Azure Kubernetes Service for sandboxing containers

$
0
0

gVisor is one option beside Kata Containers or Firecracker for sandboxing containers to minimize the risk when running untrusted workloads on Kubernetes.

-> https://gvisor.dev/

Currently, the only managed Kubernetes service which supports gVisor in dedicated node pools per default is Google Kubernetes Engine. But with a bit of an effort this is doable as well on Azure Kubernetes Service.

At the time of writing this article running gVisor on AKS is not officially supported by Microsoft. Thus said the setup can break with a Kubernetes version or node image upgrade. The setup described in this article was done on AKS v1.21.2 and the node image version AKSUbuntu-1804gen2containerd-2022.01.08.

Prerequisites

As this configuration is not officially supported the first thing on our to-do list is a new node pool. The new node pool receives a label and a taint as we want the node pool to be exclusively available for gVisor.

AKS node pool overview AKS node pool configuration

Before we can start with the installation of gVisor we need the configuration of containerd from one of the nodes in the new node pool. Otherwise, we cannot integrate gVisor with its runtime runsc into AKS.

This is done by using the run shell script capability of the VMSS via the Azure CLI.

> CONTAINERD_CONFIG=$(az vmss run-command invoke -g MC_cluster-blue_cluster-blue_northeurope -n aks-gvisor-42043378-vmss --command-id RunShellScript --instance-id 3 --scripts "cat /etc/containerd/config.toml")
> echo $CONTAINERD_CONFIG | tr -d '\'

We copy the lines between [stdout] and [stderr] into a new file config.toml. Looking at the gVisor documentation only two lines need to be added to the config.toml after line 13.

-> https://gvisor.dev/docs/user_guide/containerd/quick_start/

version = 2
subreaper = false
oom_score = 0
[plugins."io.containerd.grpc.v1.cri"]
  sandbox_image = "mcr.microsoft.com/oss/kubernetes/pause:3.6"
  [plugins."io.containerd.grpc.v1.cri".containerd]

    [plugins."io.containerd.grpc.v1.cri".containerd.untrusted_workload_runtime]
      runtime_type = "io.containerd.runtime.v1.linux"
      runtime_engine = "/usr/bin/runc"
    [plugins."io.containerd.grpc.v1.cri".containerd.default_runtime]
      runtime_type = "io.containerd.runtime.v1.linux"
      runtime_engine = "/usr/bin/runc"
    [plugins."io.containerd.grpc.v1.cri".containerd.runtimes.runsc]
      runtime_type = "io.containerd.runsc.v1"

  [plugins."io.containerd.grpc.v1.cri".registry.headers]
    X-Meta-Source-Client = ["azure/aks"]
[metrics]
  address = "0.0.0.0:10257"

The modified containerd configuration is ready to be used.

Installation

Modifying or installing something on the AKS nodes or on Kubernetes nodes is done via a daemon set in general. The daemon set itself needs a hostPath as volume mount, preferably /tmp, hostPID and privileged set to true.

Furthermore, for our use case the correct toleration and node selector configuration is necessary. We only want the daemon set on our dedicated gVisor node pool.

apiVersion: apps/v1
kind: DaemonSet
metadata:
  name: gvisor
  namespace: kube-system
spec:
  selector:
    matchLabels:
      app: gvisor
  template:
    metadata:
      labels:
        app: gvisor
    spec:
      hostPID: true
      restartPolicy: Always
      containers:
      - image: docker.io/neumanndaniel/gvisor:latest
        imagePullPolicy: Always
        name: gvisor
        env:
        - name: NODE_NAME
          valueFrom:
            fieldRef:
              fieldPath: spec.nodeName
        securityContext:
          privileged: true
          readOnlyRootFilesystem: true
        volumeMounts:
        - name: k8s-node
          mountPath: /k8s-node
      volumes:
      - name: k8s-node
        hostPath:
          path: /tmp/gvisor
      tolerations:
        - key: gvisor
          operator: Equal
          value: "enabled"
          effect: NoSchedule
      nodeSelector:
        gvisor: enabled

The referenced container image only contains the gVisor installation script and its own run script.

Looking at the gVisor installation script it is the same as in the documentation. Only the path where the binaries are placed has been adjusted to /usr/bin where the other containerd binaries reside.

-> https://gvisor.dev/docs/user_guide/install/#install-latest

#!/bin/sh

(
  set -e
  ARCH=$(uname -m)
  URL=https://storage.googleapis.com/gvisor/releases/release/latest/${ARCH}
  wget ${URL}/runsc ${URL}/runsc.sha512 \
    ${URL}/containerd-shim-runsc-v1 ${URL}/containerd-shim-runsc-v1.sha512
  sha512sum -c runsc.sha512 \
    -c containerd-shim-runsc-v1.sha512
  rm -f *.sha512
  chmod a+rx runsc containerd-shim-runsc-v1
  mv runsc containerd-shim-runsc-v1 /usr/bin
)

What does the run script do?

#!/bin/sh

URL="https://raw.githubusercontent.com/neumanndaniel/kubernetes/master/gvisor/config.toml"

wget ${URL} -O /k8s-node/config.toml
cp /install-gvisor.sh /k8s-node

/usr/bin/nsenter -m/proc/1/ns/mnt -- chmod u+x /tmp/gvisor/install-gvisor.sh
/usr/bin/nsenter -m/proc/1/ns/mnt /tmp/gvisor/install-gvisor.sh
/usr/bin/nsenter -m/proc/1/ns/mnt -- cp /etc/containerd/config.toml /etc/containerd/config.toml.org
/usr/bin/nsenter -m/proc/1/ns/mnt -- cp /tmp/gvisor/config.toml /etc/containerd/config.toml
/usr/bin/nsenter -m/proc/1/ns/mnt -- systemctl restart containerd

echo "[$(date +"%Y-%m-%d %H:%M:%S")] Successfully installed gvisor and restarted containerd on node ${NODE_NAME}."

sleep infinity

The run script downloads the config.toml from GitHub as we do not want to rebuild the container image every time this file changes. In the next step the install script is copied over to the AKS node using the hostPath volume mount. Finally, we execute the install script via nsenter on the node, backing up the original containerd configuration file and replacing it. The last step is a restart of containerd itself applying the new configuration. As containerd is only a CRI running containers will not be restarted. Afterwards the daemon set is kept running with an infinite sleep.

The container image I am using is based on Alpine’s current version 3.15.0.

FROM alpine:3.15.0
COPY install-gvisor.sh /
COPY run.sh /
RUN chmod u+x run.sh
CMD ["./run.sh"]

Using gVisor

Before we can start using gVisor as sandboxed runtime we need to make Kubernetes aware of it. This is achieved via a runtime class.

apiVersion: node.k8s.io/v1
kind: RuntimeClass
metadata:
  name: gvisor
handler: runsc
scheduling:
  nodeSelector:
    gvisor: "enabled"

In the runtime class itself gVisor is referenced by its handler runsc as defined in the config.toml.

...
    [plugins."io.containerd.grpc.v1.cri".containerd.runtimes.runsc]
...

Our example pod template deploys a NGINX proxy onto the gVisor node pool.

apiVersion: v1
kind: Pod
metadata:
  name: nginx-gvisor
spec:
  containers:
  - name: nginx
    image: nginx
  runtimeClassName: gvisor
  tolerations:
    - key: gvisor
      operator: Equal
      value: "enabled"
      effect: NoSchedule
  nodeSelector:
    gvisor: enabled

Important is the definition of the runtime class as otherwise Kubernetes uses runc, the default runtime. Furthermore, for the sake of completeness we specify the toleration and the node selector.

Verify gVisor usage

After the deployment of our NGINX pod, we verify if it is really using gVisor as its runtime.

For the first option we need the containerID which we retrieve by running the following command

> kubectl get pods nginx-gvisor -o json | jq '.status.containerStatuses[].containerID' -r | cut -d '/' -f3
19733ecbcd7287b511a18d94644b02a1f9788259429ea296e8b1f1ea7084a52f

Then we need the node name and which gVisor daemon set pod runs on the node.

> kubectl get pods --all-namespaces -o wide | grep $(kubectl get pods nginx-gvisor -o json | jq '.spec.nodeName' -r)
calico-system       calico-node-xp722                               1/1     Running   0          97m   10.240.0.4     aks-gvisor-42043378-vmss000003      <none>           <none>
istio-system        istio-cni-node-g9fzt                            2/2     Running   0          97m   10.240.0.4     aks-gvisor-42043378-vmss000003      <none>           <none>
kube-system         azure-ip-masq-agent-h5w7z                       1/1     Running   0          97m   10.240.0.4     aks-gvisor-42043378-vmss000003      <none>           <none>
kube-system         azuredefender-publisher-ds-wx5bf                1/1     Running   0          97m   10.240.0.122   aks-gvisor-42043378-vmss000003      <none>           <none>
kube-system         csi-azuredisk-node-89vw5                        3/3     Running   0          97m   10.240.0.4     aks-gvisor-42043378-vmss000003      <none>           <none>
kube-system         csi-azurefile-node-pnvq6                        3/3     Running   0          97m   10.240.0.4     aks-gvisor-42043378-vmss000003      <none>           <none>
kube-system         gvisor-ws7f4                                    1/1     Running   0          97m   10.240.0.182   aks-gvisor-42043378-vmss000003      <none>           <none>
kube-system         kube-proxy-2jctz                                1/1     Running   0          97m   10.240.0.4     aks-gvisor-42043378-vmss000003      <none>           <none>
kube-system         nginx-gvisor                                    1/1     Running   0          12m   10.240.0.150   aks-gvisor-42043378-vmss000003      <none>           <none>
kube-system         omsagent-xk5g5                                  2/2     Running   0          97m   10.240.0.13    aks-gvisor-42043378-vmss000003      <none>           <none>

Afterwards we do an exec into the gVisor pod and query the containerd status log.

> kubectl exec -it gvisor-ws7f4 -- /bin/sh
> /usr/bin/nsenter -m/proc/1/ns/mnt -- systemctl status containerd | grep 19733ecbcd7287b511a18d94644b02a1f9788259429ea296e8b1f1ea7084a52f
           ├─18404 grep 19733ecbcd7287b511a18d94644b02a1f9788259429ea296e8b1f1ea7084a52f
           ├─21181 runsc-gofer --root=/run/containerd/runsc/k8s.io --log=/run/containerd/io.containerd.runtime.v2.task/k8s.io/19733ecbcd7287b511a18d94644b02a1f9788259429ea296e8b1f1ea7084a52f/log.json --log-format=json --log-fd=3 gofer --bundle /run/containerd/io.containerd.runtime.v2.task/k8s.io/19733ecbcd7287b511a18d94644b02a1f9788259429ea296e8b1f1ea7084a52f --spec-fd=4 --mounts-fd=5 --io-fds=6 --io-fds=7 --io-fds=8 --io-fds=9 --io-fds=10 --io-fds=11 --apply-caps=false --setup-root=false
           └─21228 runsc --root=/run/containerd/runsc/k8s.io --log=/run/containerd/io.containerd.runtime.v2.task/k8s.io/19733ecbcd7287b511a18d94644b02a1f9788259429ea296e8b1f1ea7084a52f/log.json --log-format=json wait 19733ecbcd7287b511a18d94644b02a1f9788259429ea296e8b1f1ea7084a52f

Looking at the output we confirm that runsc is used.

Another approach is an exec into the NGINX proxy pod and execute the installation of ping.

> kubectl exec -it nginx-gvisor -- /bin/sh
> apt update && apt install iputils-ping -y
...
Setting up iputils-ping (3:20210202-1) ...
Failed to set capabilities on file `/bin/ping' (Operation not supported)
The value of the capability argument is not permitted for a file. Or the file is not a regular (non-symlink) file
Setcap failed on /bin/ping, falling back to setuid
...

The installation succeeds, but the set of required capabilities fails as we run in a sandbox provided by gVisor. Using the default runc runtime we will not see this error message as the NGINX proxy pod will not be running in a sandbox.

Summary

It takes a bit of work and ongoing maintenance using gVisor on AKS for sandboxing containers. But it works. Even gVisor is not officially supported by Microsoft we use a supported way doing the node configuration via a daemon set.

-> https://docs.microsoft.com/en-us/azure/aks/support-policies#shared-responsibility

The impact on a production cluster is further reduced by using a dedicated node pool for gVisor. Hence, if you need a sandbox for untrusted workloads gVisor is a viable option for this on AKS.

As always, you find the code examples and Kubernetes templates in my GitHub repository.

-> https://github.com/neumanndaniel/kubernetes/tree/master/gvisor

Der Beitrag Running gVisor on Azure Kubernetes Service for sandboxing containers erschien zuerst auf Daniel's Tech Blog.

Remove dangling multi-arch container manifests from Azure Container Registry

$
0
0

Last year I wrote a blog post about removing dangling container manifests from ACR.

-> https://www.danielstechblog.io/remove-dangling-container-manifests-from-azure-container-registry/

I did not cover an edge case when it comes to multi-arch container manifests. So, here we are, and I walk you through that topic today.

First, do not be afraid the PowerShell script from last year works perfectly with multi-arch images created by the default method.

Normally, multi-arch container manifests get created doing multiple steps after another. Let us assume we want to have a multi-arch container manifest containing an amd64 and an arm64 manifest. In our first step we build an amd64 and an arm64 image and push those images to our ACR. Then we create our final multi-arch container manifest which references the amd64 and arm64 one.

In the end we have three container manifests in our ACR with three different tags. When we push new versions with the same tags the previous ones get untagged and will be removed during the next script execution. So, no big deal.

Now let us take a look into the edge case building multi-arch containers manifests with docker buildx.

docker buildx

Using docker buildx simplifies the multi-arch container manifest build by reducing a multi-step process into one. The only downside is that the referenced amd64 and arm64 container manifests are pushed to the ACR as untagged manifests.

> (Get-AzContainerRegistryManifest -RegistryName "azstcr" -RepositoryName "ubuntu").ManifestsAttributes | Sort-Object -Property LastUpdateTime -Descending
Digest               : sha256:99175bbbd182bded8342c0ef2bba93a02b7d864f4746624c70749d39a5cdbe58
ImageSize            : 0
CreatedTime          : 2022-02-17T21:19:24.7867985Z
LastUpdateTime       : 2022-02-17T21:19:24.7867985Z
Architecture         :
Os                   :
MediaType            : application/vnd.docker.distribution.manifest.list.v2+json
ConfigMediaType      :
Tags                 : {latest}
ChangeableAttributes : Microsoft.Azure.Commands.ContainerRegistry.Models.PSChangeableAttribute

Digest               : sha256:685665a5c8d85acb5974bd2c552f1a1155b525086cbe5320cc0f56a856d92f45
ImageSize            : 27169640
CreatedTime          : 2022-02-17T21:19:24.4302273Z
LastUpdateTime       : 2022-02-17T21:19:24.4302273Z
Architecture         : arm64
Os                   : linux
MediaType            : application/vnd.docker.distribution.manifest.v2+json
ConfigMediaType      : application/vnd.docker.container.image.v1+json
Tags                 :
ChangeableAttributes : Microsoft.Azure.Commands.ContainerRegistry.Models.PSChangeableAttribute

Digest               : sha256:e50152615c84948a44845d5cf7be7463dcc4d38b5c0718f7dd3c243c606cce0c
ImageSize            : 28564099
CreatedTime          : 2022-02-17T21:19:24.0868396Z
LastUpdateTime       : 2022-02-17T21:19:24.0868396Z
Architecture         : amd64
Os                   : linux
MediaType            : application/vnd.docker.distribution.manifest.v2+json
ConfigMediaType      : application/vnd.docker.container.image.v1+json
Tags                 :
ChangeableAttributes : Microsoft.Azure.Commands.ContainerRegistry.Models.PSChangeableAttribute

ACR container manifest

Let us assume we already built our multi-arch container manifest and pushed it into the ACR by running the following command.

> docker buildx build --push --platform linux/arm64,linux/amd64 --tag azstcr.azurecr.io/ubuntu:latest .

We pull the image to our workstation which in the end succeeds.

> docker pull azstcr.azurecr.io/ubuntu:latest
latest: Pulling from ubuntu
08c01a0ec47e: Pull complete
Digest: sha256:44959906cfef41a65e4019acf6e4944059100a8682d45f45d4cfaa0a07c166a5
Status: Downloaded newer image for azstcr.azurecr.io/ubuntu:latest
azstcr.azurecr.io/ubuntu:latest

Now we execute our PowerShell script and try to pull the image on another workstation.

> pwsh Remove-UntaggedManifests.ps1
------------------------
Delete dangling image ubuntu@sha256:df52b11a7a3512d98117f3277363d03b5d0dc89be9777893366f01f59c1dae45
True
------------------------
Delete dangling image ubuntu@sha256:6668c313d6c9395b1132d214aa716916f86be9754fac58186e44ada94866c7e9
True

> docker pull azstcr.azurecr.io/ubuntu:latest
latest: Pulling from ubuntu
manifest for azstcr.azurecr.io/ubuntu:latest not found: manifest unknown: manifest sha256:df52b11a7a3512d98117f3277363d03b5d0dc89be9777893366f01f59c1dae45 is not found

The image pull fails as the image cannot be found which is true. As earlier mentioned docker buildx does not tag the referenced amd64 and arm64 container manifests. Hence, they get deleted by the PowerShell script. We have only the tagged multi-arch container manifest in our ACR with the empty manifest references.

Solution

The solution for this problem is an additional step in the script checking for referenced manifests and putting them onto an exclusion list.

...
    foreach ($ITEM in $MANIFESTS) {
      $TAG = $ITEM.digest
      $ITEM_DETAILS = Invoke-RestMethod -Uri https://$ACR_URL/v2/$REPO/manifests/$TAG -Authentication Basic -Method Get -Credential $CREDENTIAL -Headers $HEADERS
      if ($ITEM_DETAILS.manifests -ne $null) {
        $EXCLUDE_LIST += $ITEM_DETAILS.manifests.digest
      }
      if ($ITEM.Tags -eq $null -and $ITEM.digest -notin $EXCLUDE_LIST) {
        Write-OutPut "------------------------"
        Write-Output "Delete dangling image $REPO@$TAG"
        Remove-AzContainerRegistryManifest -RegistryName $ACR.Name -RepositoryName $REPO -Manifest $TAG
      }
    }
...

Unfortunately, Azure PowerShell has no cmdlet for doing this and we must fall back to the ACR REST API here.

The additional check overall increases the runtime of the script itself. That is the reason for having two different versions of the script in my GitHub repository now. One for the default method of creating multi-arch container manifests or using only amd64 container manifests for instance and one for creating multi-arch container manifests with docker buildx.

-> https://github.com/neumanndaniel/kubernetes/blob/master/acr/Remove-UntaggedManifestsDockerBuildx.ps1

Der Beitrag Remove dangling multi-arch container manifests from Azure Container Registry erschien zuerst auf Daniel's Tech Blog.

Using Rancher Desktop as Docker Desktop replacement on macOS

$
0
0

Last year I wrote a blog post about running Podman on macOS with Multipass as a Docker Desktop replacement.

-> https://www.danielstechblog.io/running-podman-on-macos-with-multipass/

Back at that time I had looked also into Podman Machine and Rancher Desktop. Podman Machine was out very quickly without support for host volume mounts. Rancher Desktop instead was promising but the host volume mount performance was not that what I am used to, and you could not disable the Kubernetes component.

Since Rancher Desktop version 1.1.0, which has been released a couple of days ago, you can finally disable the Kubernetes component just using containerd or dockerd as your container runtime. Also, the host volume mount performance is now as good what Docker Desktop provides.

-> https://github.com/rancher-sandbox/rancher-desktop/releases/tag/v1.1.0

Kubernetes can be disabled to run just containerd or dockerd by itself for reduced resource consumption.

-> https://rancherdesktop.io/

So, here we are again talking about how to replace Docker Desktop on macOS with Rancher Desktop.

Rancher Desktop

When you have installed Rancher Desktop and start it for the first time you are greeted by the initial configuration screen.

Rancher Desktop Setup Screen

As I do not want to use the built-in Kubernetes component of Rancher Desktop, I uncheck it and switching the container runtime from containerd to dockerd.

The reason I am disabling the built-in Kubernetes component is the following that I am using KinD (Kubernetes in Docker) as my local Kubernetes setup providing a near identical setup locally what I am using in Azure with AKS. KinD offers a lot of customization like using another CNI component like Calico for CNI and network policies instead of relying on the built-in one. But this is a matter of taste, and you might be happy with the built-in Kubernetes component k3s of Rancher Desktop.

Rancher Desktop resource configuration

Rancher Desktop uses per default 2 CPUs and 4 GB memory which I adjusted to 4 CPUs and 8 GB memory. Those changes are applied by hitting the button Reset Kubernetes which in the end restarts Rancher Desktop.

Before we start with a quick check of Rancher Desktop let me tell you something about the default host volume mounts Rancher Desktop provides. Per default your home folder and the folder /tmp/rancher-desktop are available for mounting them into your containers.

Now let us do the quick check. I am spinning up the ACI hello world container image from Microsoft and map the port to port 80.

> docker run -d -p 80:80 mcr.microsoft.com/azuredocs/aci-helloworld:latest

> docker ps
CONTAINER ID   IMAGE                                               COMMAND                  CREATED          STATUS          PORTS                               NAMES
c6cad07051b9   mcr.microsoft.com/azuredocs/aci-helloworld:latest   "/bin/sh -c 'node /u…"   16 seconds ago   Up 14 seconds   0.0.0.0:80->80/tcp, :::80->80/tcp   clever_goldberg

Rancher Desktop ACI hello world

Like Docker Desktop the ACI hello world container can be reached via localhost.

If you want to use KinD as well on Rancher Desktop for Kubernetes, make sure you use the latest release v0.12.0.

-> https://github.com/kubernetes-sigs/kind/releases/tag/v0.12.0

I had not any success to spin up KinD with the version before on Rancher Desktop.

> docker ps
CONTAINER ID   IMAGE                  COMMAND                  CREATED        STATUS          PORTS                                                                                                     NAMES
f9dab90645b0   kindest/node:v1.23.4   "/usr/local/bin/entr…"   47 hours ago   Up 53 seconds   127.0.0.1:6443->6443/tcp, 127.0.0.1:80->30000/tcp, 127.0.0.1:443->30001/tcp, 127.0.0.1:15021->30002/tcp   kind-control-plane

> kubectl get nodes -o wide
NAME                 STATUS   ROLES                  AGE   VERSION   INTERNAL-IP   EXTERNAL-IP   OS-IMAGE       KERNEL-VERSION   CONTAINER-RUNTIME
kind-control-plane   Ready    control-plane,master   47h   v1.23.4   172.18.0.2    <none>        Ubuntu 21.10   5.10.93-0-virt   containerd://1.5.10

> kubectl get pods -n kube-system
NAME                                         READY   STATUS    RESTARTS      AGE
azure-policy-86bcfd97bf-n82kr                1/1     Running   4 (75s ago)   46h
azure-policy-webhook-559c5b7cb9-tlv96        1/1     Running   4 (75s ago)   46h
coredns-64897985d-b6z7p                      1/1     Running   2 (75s ago)   47h
coredns-64897985d-jkblr                      1/1     Running   2 (75s ago)   47h
etcd-kind-control-plane                      1/1     Running   2 (75s ago)   47h
kube-apiserver-kind-control-plane            1/1     Running   2 (75s ago)   47h
kube-controller-manager-kind-control-plane   1/1     Running   5 (75s ago)   47h
kube-proxy-r8f9f                             1/1     Running   2 (75s ago)   47h
kube-scheduler-kind-control-plane            1/1     Running   5 (75s ago)   47h
metrics-server-865ff485bf-gkxwl              1/1     Running   5 (75s ago)   47h

Summary

When you are looking for a real drop-in replacement of Docker Desktop on macOS, Rancher Desktop got you covered. As Rancher Desktop provides dockerd as runtime beside containerd all commands like docker and docker-compose continue to work out of the box. Also, Visual Studio Code immediately recognizes Rancher Desktop when you use dockerd as container runtime.

VS Code Docker Extension

Der Beitrag Using Rancher Desktop as Docker Desktop replacement on macOS erschien zuerst auf Daniel's Tech Blog.

Kubernetes CPU requests demystified

$
0
0

Two weeks back I participated in an incredibly good and vivid discussion on Twitter about Kubernetes CPU requests and limits. During the discussion I learned a lot and were proven that my knowledge and statement are not correct.

I had made the following statement: “CPU requests are used for scheduling but are not guaranteed at runtime.”

The first part about the scheduling is correct and the second part is simply wrong. Reflecting on the discussion, I cannot tell you how it came to this understanding. Four years ago, I read the de-facto standard book about Kubernetes “Kubernetes: Up and Running” which clearly and correctly explains it.

“With Kubernetes, a Pod requests the resources required to run its containers. Kubernetes guarantees that these resources are available to the Pod”

Kubernetes: Up & Running, Hightower, Burns, and Beda, September 2017

So, I should know it better and might have gotten confused by the following sentence from the Kubernetes docs and observations of high CPU load on Kubernetes.

“The kubelet also reserves at least the request amount of that system resource specifically for that container to use”

-> https://kubernetes.io/docs/concepts/configuration/manage-resources-containers/

How can something be reserved, set aside, for one pod and be used by another one at the same time? Let us stop here. I had at some point in time the wrong knowledge and learned it is not correct. So, I am writing this blog post to clarify how CPU requests in Kubernetes work and what I learned.

Introduction

So, what are Kubernetes CPU requests? CPU requests specify the minimum amount of compute capacity required by your application to run. You can specify CPU requests for each container in your pod. The sum of all CPU requests is then used with specified memory requests by the scheduler finding a node in the Kubernetes cluster with enough resources available.

Once the pod runs on a node its CPU requests are guaranteed / reserved.

What does guaranteed / reserved mean?

As already mentioned in the Kubernetes docs the term reserved is used and, in the book “Kubernetes: Up and Running” guaranteed. Depending on our cultural and personal understanding both words have a different meaning for us and might be contradictory to what we observe in our Kubernetes cluster.

Hence, I try to make it clearer. When pods using a CPU request and got scheduled onto a node Kubernetes provides them with an SLA (Service Level Agreement). The SLA statement between the pod and Kubernetes can be phrased like this:

“Whenever you need your CPU requests you immediately get them assigned and have them available. However, every other pod on the node can use your CPU requests as long as you do not need them by yourself.”

That is exactly how CPU requests in Kubernetes works. As long as the original pod does not need them, they are available in a pool to be used by every other pod on the node. Whenever the original pod needs its CPU requests the CPU scheduler immediately assigns the compute capacity to the pod.

Hence, CPU requests are always guaranteed at runtime.

Quod erat demonstrandum

In this example I am using the containerstack CPU stress test tool image generating constant CPU load for my four pods which will be deployed onto my three node Azure Kubernetes Service cluster.

-> https://github.com/containerstack/docker-cpustress

Each node has four cores and 16 GB memory available. According to the AKS docs a specific amount of the node resources is set aside to protect and keep the node operational.

-> https://docs.microsoft.com/en-us/azure/aks/concepts-clusters-workloads?WT.mc_id=AZ-MVP-5000119#resource-reservations

The Kubernetes template I am using deploys all four pods onto the same node and keeps the CPU stress test running for an hour. Each pod has a CPU request of 0.5.

-> https://github.com/neumanndaniel/kubernetes/blob/master/cpu-requests/cpu-stress.yaml

Running cpu stress test

Now I need a pod which is idling around and does not use its CPU requests. As a system pod is an excellent choice I selected the azure-ip-masq-agent which CPU requests are 100m.

> kubectl resource_capacity --pod-labels k8s-app=azure-ip-masq-agent --pods
NODE                                NAMESPACE     POD                         CPU REQUESTS   CPU LIMITS    MEMORY REQUESTS   MEMORY LIMITS
*                                   *             *                           300m (2%)      1500m (12%)   150Mi (0%)        750Mi (1%)

aks-nodepool1-14987876-vmss000026   *             *                           100m (2%)      500m (12%)    50Mi (0%)         250Mi (1%)
aks-nodepool1-14987876-vmss000026   kube-system   azure-ip-masq-agent-8pwl6   100m (2%)      500m (12%)    50Mi (0%)         250Mi (1%)

aks-nodepool1-14987876-vmss000027   *             *                           100m (2%)      500m (12%)    50Mi (0%)         250Mi (1%)
aks-nodepool1-14987876-vmss000027   kube-system   azure-ip-masq-agent-dnb85   100m (2%)      500m (12%)    50Mi (0%)         250Mi (1%)

aks-nodepool1-14987876-vmss000028   *             *                           100m (2%)      500m (12%)    50Mi (0%)         250Mi (1%)
aks-nodepool1-14987876-vmss000028   kube-system   azure-ip-masq-agent-6h5zq   100m (2%)      500m (12%)    50Mi (0%)         250Mi (1%)

I am using kubectl exec -it to get a terminal on the pod and then run while true; do echo; done generating a high CPU load.

Running high cpu load on system pod

As seen above the azure-ip-masq-agent pod immediately gets at least its CPU requests assigned. In this demo a bit more which leads us to another interesting point how CPU requests work on a contended system.

CPU request behavior on contended systems

The behavior of CPU requests on contended systems is briefly explained in the Kubernetes docs.

“The CPU request typically defines a weighting. If several different containers (cgroups) want to run on a contended system, workloads with larger CPU requests are allocated more CPU time than workloads with small requests.”

-> https://kubernetes.io/docs/concepts/configuration/manage-resources-containers/#how-pods-with-resource-limits-are-run

When pods with different request amounts compete against each other for compute capacity Kubernetes assigns more compute capacity to the one with the higher request amount.

That said pods with a higher CPU request than other pods are given higher priority when it comes to assigning compute capacity on a contended system.

Summary

The key take-away for you is that CPU requests are used for the scheduling and guaranteed at runtime.

What this means when looking at the Quality of Service classes for pods in Kubernetes is the following:

A pod without CPU requests and limits has the QoS class BestEffort without any guarantees of receiving the needed or desired compute capacity.

Pods with CPU requests have the guarantee at any time receiving their defined requests and are able to run your application with its minimal desires. The QoS class here is Burstable.

When you need a guarantee that at any given time your application can get the compute capacity it needs to deliver the best performance you have two options:

  1. Set the pod’s CPU request high enough which results again in the QoS class Burstable.
  2. Set the pod’s CPU requests and limits to the same value or only set the limits. Then the pod gets the QoS class Guaranteed

I hope I shed some light on how CPU requests work on Kubernetes. An interesting follow-up read on this topic is about why you should not specify CPU limits.

-> https://home.robusta.dev/blog/stop-using-cpu-limits/

As always in IT the answer is it depends on. Finally, ensure at least you use CPU requests.

Der Beitrag Kubernetes CPU requests demystified erschien zuerst auf Daniel's Tech Blog.

Conditions with for_each in Terraform

$
0
0

Conditions in Terraform are well-known and can provide in combination with the for_each argument a lot of flexibility. In today’s blog post I walk you through an example storage module I have created to showcase the topic.

The module consists of three resources a resource group, a lock, and a storage account. As I am using conditions with for_each for the resource group and the lock I can decide whether my storage account gets created in a new resource group and the resource group is delete protected by the lock or not.

resource "azurerm_resource_group" "rg" {
  for_each = var.resource_group == true ? toset([var.resource_group_name]) : toset([])
  name     = var.resource_group_name
  location = var.location
}

resource "azurerm_management_lock" "lock" {
  for_each   = var.lock == true && var.resource_group == true ? toset([var.resource_group_name]) : toset([])
  name       = "rg-level"
  scope      = azurerm_resource_group.rg[var.resource_group_name].id
  lock_level = "CanNotDelete"
}

Depending on my settings the for_each argument receives a set with one element, the resource group name, or an empty set. Some can argue for that use case you have the count argument which is valid and correct. But the count argument is index-based where for_each is key-based. The key-based approach always provides you with the same resource address in the Terraform state where the address with the index-based approach can change if you delete the resource. This leads to unpredictable behavior.

...
module "storage1" {
  source               = "./modules/storage"
  resource_group_name  = "rg12345"
  location             = "northeurope"
  storage_account_name = "azcdmdn12345"
  lock                 = true
}

module "storage2" {
  source               = "./modules/storage"
  resource_group       = false
  resource_group_name  = module.storage1.resource_group_name
  location             = "westeurope"
  storage_account_name = "azcdmdn67890"
  identity             = true
}
...

In the code sample above I create the first storage account within a new resource group which is protected by a lock. The second storage account gets provisioned to the same resource group as the first one. Hence, the variable resource_group is set to false.

Furthermore, the second storage account needs a managed identity and here we see the great combination of conditions with the for_each argument.

Storage accounts in resource group Resource lock on resource group Managed identity

So, let us have a look at the storage account resource.

resource "azurerm_storage_account" "storage" {
  name                     = var.storage_account_name
  resource_group_name      = var.resource_group == true ? azurerm_resource_group.rg[var.resource_group_name].name : var.resource_group_name
  location                 = var.resource_group == true ? azurerm_resource_group.rg[var.resource_group_name].location : var.location
  account_tier             = "Standard"
  account_replication_type = "LRS"

  dynamic "identity" {
    for_each = var.identity == true ? toset([var.storage_account_name]) : toset([])
    content {
      type = "SystemAssigned"
    }
  }
}

When you want a storage account with a managed identity then you use the identity block within the resource. The only way of making a block within a resource configurable via a condition is the use of the dynamic block which requires the for_each argument.

...
  dynamic "identity" {
    for_each = var.identity == true ? toset([var.storage_account_name]) : toset([])
    content {
      type = "SystemAssigned"
    }
  }
...

This is the true power of conditions with for_each. Making blocks in a resource configurable without the need to specify two different storage account resources for different configuration options.

You find the code samples in my GitHub repository.

-> https://github.com/neumanndaniel/terraform/tree/master/conditions-for-each-demo

Der Beitrag Conditions with for_each in Terraform erschien zuerst auf Daniel's Tech Blog.

Preventing SNAT port exhaustion on Azure Kubernetes Service with Virtual Network NAT

$
0
0

Last year I have written a blog post about detecting SNAT port exhaustion on Azure Kubernetes Service.

-> https://www.danielstechblog.io/detecting-snat-port-exhaustion-on-azure-kubernetes-service/

Today we dive into the topic of how to prevent SNAT port exhaustion on Azure Kubernetes Service with Virtual Network NAT.

Since this year the managed NAT gateway option for Azure Kubernetes Service is generally available and can be set during the cluster creation.

-> https://docs.microsoft.com/en-us/azure/aks/nat-gateway?WT.mc_id=AZ-MVP-5000119

Unfortunately, as of writing this blog post, you cannot update existing Azure Kubernetes Service clusters with the outbound type loadBalancer to the outbound type managedNATGateway or userAssignedNATGateway.

Before we dive deeper into the topic of preventing SNAT port exhaustion on Azure Kubernetes Service let us step back and talk about what SNAT port exhaustion is.

What is SNAT port exhaustion?

SNAT, Source Network Address Translation, is used in AKS whenever an outbound call to an external address is made. Assuming you use AKS in its standard configuration, it enables IP masquerading for the backend VMSS instances of the load balancer.

SNAT ports get allocated for every outbound connection to the same destination IP and destination port. The default configuration of an Azure Kubernetes Service cluster provides 64.000 SNAT ports with a 30-minute idle timeout before idle connections are released.

When running into SNAT port exhaustion new outbound connections fail.

What is Virtual Network NAT?

Virtual Network NAT simplifies the outbound internet connectivity for a virtual network as a fully managed network address translation service. Once activated on a subnet all outbound connectivity is handled by Virtual Network NAT as it takes precedence over other configured outbound scenarios.

-> https://docs.microsoft.com/en-us/azure/virtual-network/nat-gateway/nat-overview?WT.mc_id=AZ-MVP-5000119#outbound-connectivity

Furthermore, the Virtual Network NAT can use up to 16 public IP addresses which results in 1032192 available SNAT ports that can be dynamically allocated on-demand for every resource in the subnet.

-> https://docs.microsoft.com/en-us/azure/virtual-network/nat-gateway/nat-gateway-resource?WT.mc_id=AZ-MVP-5000119#nat-gateway-dynamically-allocates-snat-ports

SNAT port exhaustion prevention options

Currently, you have two options to prevent workloads on an AKS cluster from running into SNAT port exhaustion.

Number one is to assign enough public IPs to the load balancer, set a custom value for the allocated SNAT ports per node, and set the TCP idle reset to 4 minutes.

The automatic default for the allocated SNAT ports per node depends on the cluster size and starts with 1024 SNAT ports and ends at 32 SNAT ports per node. Also, the default TCP idle reset is 30 minutes.

In the end, you are still at risk of running into SNAT port exhaustion.

Number two is to use the Virtual Network NAT. But do not use the outbound type managedNATGateway or userAssignedNATGateway in the Azure Kubernetes Service configuration.

Using Virtual Network NAT

So, why should you still stick to the outbound type loadBalancer in the Azure Kubernetes Service configuration? Remember what I wrote at the beginning of the blog post?

Once activated on a subnet all outbound connectivity is handled by Virtual Network NAT as it takes precedence over other configured outbound scenarios. When you use managedNATGateway or userAssignedNATGateway you cannot recover yourself from a Virtual Network NAT outage without redeploying the Azure Kubernetes Service cluster. This also counts towards enabling those outbound types on existing Azure Kubernetes Service clusters, you must redeploy the cluster.

Using the outbound type loadBalancer lets you disassociate the Virtual Network NAT from the subnet and AKS will leverage the outbound rules from the load balancer for outbound connectivity in case of a Virtual Network NAT outage. Also, this configuration lets you switch to Virtual Network NAT on an existing Azure Kubernetes Service cluster.

Let us see this configuration option in action.

I simply deployed an Azure Kubernetes Service cluster via the Azure portal with the Azure CNI plugin enabled. So, the load balancer of the cluster is configured with the default values like the TCP idle reset of 30 minutes. Furthermore, I deployed a Virtual Network NAT gateway with a TCP idle reset of 4 minutes and did not associate the NAT gateway with the AKS subnet yet.

-> https://docs.microsoft.com/en-us/azure/aks/learn/quick-kubernetes-deploy-portal?WT.mc_id=AZ-MVP-5000119
-> https://docs.microsoft.com/en-us/azure/virtual-network/nat-gateway/quickstart-create-nat-gateway-portal?WT.mc_id=AZ-MVP-5000119#nat-gateway

Azure Dashboard showing SNAT statistics

As seen in the screenshot above all outbound connectivity gets handled by the load balancer as the AKS nodes got a fixed amount of SNAT ports assigned to them.

Azure Dashboard showing SNAT statistics Azure Dashboard showing SNAT statistics

Now we associate the NAT gateway with the AKS subnet. It takes a while till all outbound connectivity gets handled by the NAT gateway due to the default TCP idle reset of 30 minutes of the load balancer.

An important note at this point from the Azure documentation:

When NAT gateway is configured to a virtual network where standard Load balancer with outbound rules already exists, NAT gateway will take over all outbound traffic moving forward. There will be no drops in traffic flow for existing connections on Load balancer. All new connections will use NAT gateway.

-> https://docs.microsoft.com/en-us/azure/virtual-network/nat-gateway/nat-overview?WT.mc_id=AZ-MVP-5000119#outbound-connectivity

The transfer from the load balancer to the NAT gateway is seamless for your workloads running on AKS.

Azure Dashboard showing SNAT statistics

In case of a Virtual Network NAT outage, you simply disassociate the NAT gateway from the AKS subnet, and outbound connectivity is handled again by the load balancer as seen above in the screenshot.

Summary

The most effective way for you to prevent SNAT port exhaustion on an Azure Kubernetes Service cluster is the usage of Virtual Network NAT.

Depending on your needs you can use the above-described configuration enabling Virtual Network NAT for existing Azure Kubernetes Service clusters and have a DR strategy in place when it comes to a Virtual Network NAT outage. The configuration as described above allows you to reestablish outbound connectivity of your workloads till a Virtual Network NAT outage has been resolved.

Or you deploy a new Azure Kubernetes Service cluster with the outbound type managedNATGateway or userAssignedNATGateway enabled.

But as of writing this blog post, you cannot update existing Azure Kubernetes Service clusters with the outbound type loadBalancer to the outbound type managedNATGateway or userAssignedNATGateway nor you can switch back to the outbound type loadBalancer without redeploying an Azure Kubernetes Service cluster if it has been provisioned with the managedNATGateway or userAssignedNATGateway option.

That said in case of a Virtual Network NAT outage, and you depend on outbound connectivity for your workloads the official configuration for using Virtual Network NAT on AKS with the outbound types managedNATGateway or userAssignedNATGateway might not be the one you would like to use.

Der Beitrag Preventing SNAT port exhaustion on Azure Kubernetes Service with Virtual Network NAT erschien zuerst auf Daniel's Tech Blog.

How to change the node size of the default node pool in AKS without downtime?

$
0
0

Currently, as of writing this blog post, Azure Kubernetes Service does not support changing the node size of the default node pool or additional node pools without recreating the whole AKS cluster or the additional node pool.

Having all the configuration in infrastructure as code whether it is Bicep or Terraform seems to be a dead end for this simple operation. If we change the node size in our IaC definition for the default node pool, the AKS cluster gets deleted first and then created again in the case of Terraform or just breaks the deployment in the case of Bicep. This is not an option for a production AKS cluster.

Another way can be an entirely new AKS cluster with the correct node size and then migrating all the workloads over from the old to the new AKS cluster. Depending on the usage of additional Azure networking services this can be done without any downtime for your customers. But still, this is a time-consuming task.

So, what else can we do?

There is another option available that requires some manual interaction that can be somehow automated with one or several shell scripts.

Change the node size of the default node pool without downtime

The procedure requires several steps to be executed one after another.

First, we add a new node pool of type System with the new node size to our AKS cluster by running az aks nodepool add with all the necessary parameters we need. After that, we disable the cluster autoscaler on the default node pool by running az aks nodepool update –disable-cluster-autoscaler. This ensures that we do not get any new nodes on the default node pool when executing our drain operation on this node pool.

AKS default node pool AKS default node pool and newly added node pool

Now, we can initiate the drain operation for all nodes in the default node pool by iterating over every node and executing the command kubectl drain ${NODE_NAME} –delete-emptydir-data –ignore-daemonsets. The Kubernetes nodes are marked as not available for scheduling and every pod on the nodes gets evicted by respecting pod disruption budgets and is scheduled onto the newly added node pool. One node after another in the default node pool gets prepared for the upcoming node pool deletion.

> kubectl drain aks-nodepool1-11750814-vmss000003 aks-nodepool1-11750814-vmss000004 aks-nodepool1-11750814-vmss000005 --delete-empty-dir --ignore-daemonsets
...
evicting pod kube-system/metrics-server-948cff58d-l42zd
error when evicting pods/"metrics-server-948cff58d-l42zd" -n "kube-system" (will retry after 5s): Cannot evict pod as it would violate the pod's disruption budget.
...

> kubectl get nodes
NAME                                 STATUS                     ROLES   AGE     VERSION
aks-newdefault-41723878-vmss000000   Ready                      agent   6m42s   v1.23.5
aks-newdefault-41723878-vmss000001   Ready                      agent   6m42s   v1.23.5
aks-newdefault-41723878-vmss000002   Ready                      agent   7m19s   v1.23.5
aks-nodepool1-11750814-vmss000003    Ready,SchedulingDisabled   agent   15m     v1.23.5
aks-nodepool1-11750814-vmss000004    Ready,SchedulingDisabled   agent   14m     v1.23.5
aks-nodepool1-11750814-vmss000005    Ready,SchedulingDisabled   agent   15m     v1.23.5

Last but not least we delete the default node pool by running az aks nodepool delete. After the delete operation successfully proceeded our newly added node pool is now our default node pool.

AKS new default node pool

One final step that needs to be done is adjusting our IaC definition with the new name for the default node pool and the new node size. Otherwise, on the next run of the IaC definition, the AKS cluster would be deleted and then created again or breaks the deployment as the name and the node size do not match with the IaC definition.

Summary

Even though it requires some manual interaction and an adjustment to the IaC definition this approach is the only one where you do not need to set up a new AKS cluster and replace the existing one for only changing the node size in the default node pool. Furthermore, this procedure can be executed during normal business hours without having an impact on your customers.

Hopefully, Microsoft supports the change of the node size for the default node pool and additional node pools without the requirement of recreating the AKS cluster or the node pool soon. In the end, the process to update a node pool with a new node size is the same as when you initiate a node image upgrade of a node pool. So, we can only assume why the AKS API does not leverage the underlying VMSS API capabilities yet.

At least the GitHub issue for that case has been marked as a feature request since 2021.

-> https://github.com/Azure/AKS/issues/2339

Der Beitrag How to change the node size of the default node pool in AKS without downtime? erschien zuerst auf Daniel's Tech Blog.


Migrate an Azure storage account from LRS to ZRS replication without downtime

$
0
0

This is a rather short blog post about a hidden gem in the Azure documentation.

You have two options today migrating an existing Azure storage account from the LRS (locally redundant storage) to ZRS (zone-redundant storage) replication option. A manual migration or live migration.

Choosing the manual migration option requires a new target storage account with ZRS and might imply an application downtime during the migration.

When you choose the live migration option, Microsoft executes the migration for you without an application downtime and a new target storage account. Your existing storage account will be migrated from LRS to ZRS.

Requesting a live migration for a storage account is done by opening an Azure Support ticket and that is it. Once Microsoft finished the live migration your existing storage account uses the new replication option ZRS.

Details about the process, prerequisites, and limitations are outlined in the Azure documentation.

-> https://docs.microsoft.com/en-us/azure/storage/common/redundancy-migration?WT.mc_id=AZ-MVP-5000119#request-a-live-migration-to-zrs-gzrs-or-ra-gzrs

Der Beitrag Migrate an Azure storage account from LRS to ZRS replication without downtime erschien zuerst auf Daniel's Tech Blog.

--- Article Not Found! ---

$
0
0
***
***
*** RSSing Note: Article is missing! We don't know where we put it!!. ***
***

--- Article Not Found! ---

$
0
0
***
***
*** RSSing Note: Article is missing! We don't know where we put it!!. ***
***

--- Article Not Found! ---

$
0
0
***
***
*** RSSing Note: Article is missing! We don't know where we put it!!. ***
***

Learnings from the field – Running Fluent Bit on Azure Kubernetes Service – Part 1

$
0
0

This is the first part of a three-part series about “Learnings from the field – Running Fluent Bit on Azure Kubernetes Service”.

Logging is one of the central aspects when operating Kubernetes. The easiest way to get started with it is by using the solution your cloud provider provides. On Azure, this is Azure Monitor Container Insights that can also be used on Google Kubernetes Engine and Amazon Elastic Kubernetes Service via Azure Arc.

When you look for a platform-agnostic approach that is also highly customizable, you probably end up with Fluent Bit. Besides running Fluent Bit on Kubernetes for your container logs, you can run it on VMs or bare-metal servers for logging. Nevertheless, the focus in this series is on Fluent Bit running on Azure Kubernetes Service and using Azure Log Analytics as the log backend.

I share with you specific learnings from the field operating Fluent Bit on Azure Kubernetes Service.

Kubernetes API endpoint vs. Kubelet endpoint

Per default, the Kubernetes filter plugin talks to the Kubernetes API endpoint https://kubernetes.default.svc:443 to enrich the log data with information about the Kubernetes pod.

For small and mid-sized Kubernetes clusters, this is not an issue, and you do not need to worry about overloading the API endpoint with those requests. On larger clusters, it can become an issue that the API endpoint gets unresponsive.

Hence, it is recommended to use the Kubelet endpoint instead. Fluent Bit gets deployed as a daemon set on a Kubernetes cluster. So, each node has its own Fluent Bit pod. The advantage of using the Kubelet endpoint is a faster response time to get the Kubernetes pod information and a reduced load on the API endpoint. The API endpoint approach is a 1:n relation where n is the number of Fluent Bit pods in the cluster. Whereas the Kubelet endpoint approach is a 1:1 relation.

AKS Azure portal - Fluent Bit daemon set overview

Looking at Azure Kubernetes Service, there is another advantage using the Kubelet endpoint. When you run an Azure Kubernetes Service cluster that is not a private cluster, the API endpoint has a public IP. That means when you are familiar with the topic of SNAT port exhaustion, every call from the Fluent Bit Kubernetes filter plugin to the API endpoint counts toward your available SNAT ports.

-> https://www.danielstechblog.io/detecting-snat-port-exhaustion-on-azure-kubernetes-service/
-> https://www.danielstechblog.io/preventing-snat-port-exhaustion-on-azure-kubernetes-service-with-virtual-network-nat/

My recommendation at that point is always to use the Kubelet endpoint option without considering if your Azure Kubernetes Service cluster is a small or a large one.

The configuration is straightforward and needs to be done for each Kubernetes filter configuration you use.

...
  filter-kubernetes.conf: |
    [FILTER]
        Name                kubernetes
        Alias               logs_filter_1
        Match               kubernetes.logs.*
        Kube_URL            https://kubernetes.default.svc:443
        Kube_CA_File        /var/run/secrets/kubernetes.io/serviceaccount/ca.crt
        Kube_Token_File     /var/run/secrets/kubernetes.io/serviceaccount/token
        ...
        Use_Kubelet         On
        Kubelet_Host        ${NODE_IP}
        Kubelet_Port        10250
        tls.verify          Off
...

As seen above this is a working Fluent Bit configuration for Azure Kubernetes Service using the Kubelet endpoint. The option tls.verify must be set to Off. Otherwise, we cannot connect to the Kubelet endpoint. Furthermore, we use the Kubernetes downward API to dynamically hand in the node’s IP address as an environment variable that is referenced as value for the Kubelet_Host.

...
    spec:
      containers:
      - name: fluent-bit
        ...
        env:
        - name: NODE_IP
          valueFrom:
            fieldRef:
              apiVersion: v1
              fieldPath: status.hostIP
...

The code snippet above is part of the Kubernetes template used to deploy Fluent Bit as a daemon set.

-> https://kubernetes.io/docs/tasks/inject-data-application/environment-variable-expose-pod-information/
-> https://kubernetes.io/docs/concepts/workloads/pods/downward-api/#available-fields

When we look into the Fluent Bit log output, we see that Fluent Bit successfully connects to the Kubelet endpoint.

...
[2023/01/09 20:49:40] [ info] [filter:kubernetes:logs_filter_1] https=1 host=10.240.0.4 port=10250
[2023/01/09 20:49:40] [ info] [filter:kubernetes:logs_filter_1]  token updated
[2023/01/09 20:49:40] [ info] [filter:kubernetes:logs_filter_1] local POD info OK
[2023/01/09 20:49:40] [ info] [filter:kubernetes:logs_filter_1] testing connectivity with Kubelet...
[2023/01/09 20:49:41] [ info] [filter:kubernetes:logs_filter_1] connectivity OK
...

Do not lose Kubernetes metadata information

Another important setting for the Kubernetes filter plugin is the setting Buffer_Size. The buffer size specifies the maximum size of the buffer for reading Kubernetes API responses. When Kubernetes metadata information exceeds the buffer size that information is discarded. Per default, the buffer size is 32 KB and too small. Even with a buffer size of 2 MB, you might receive the following warning message.

...
[2023/01/09 20:48:14] [ warn] [http_client] cannot increase buffer: current=32000 requested=64768 max=32000
...

That means some of the log data could not be enriched with the pod information. You only see then the time stamp and log message in the log backend. Such a log entry is not helpful as you cannot identify to which pod the log message belongs.

From my current experience, the only value that makes sense for the buffer size is 0. 0 means no limit for the buffer, and the buffer expands as needed.

...
  filter-kubernetes.conf: |
    [FILTER]
        Name                kubernetes
        Alias               logs_filter_1
        Match               kubernetes.logs.*
        Kube_URL            https://kubernetes.default.svc:443
        Kube_CA_File        /var/run/secrets/kubernetes.io/serviceaccount/ca.crt
        Kube_Token_File     /var/run/secrets/kubernetes.io/serviceaccount/token
        ...
        Use_Kubelet         On
        Kubelet_Host        ${NODE_IP}
        Kubelet_Port        10250
        tls.verify          Off
        Buffer_Size         0
...

Setting the buffer size to 0 guarantees that we do not lose Kubernetes metadata for the log enrichment. The only exception will be that the Fluent Bit pod runs into an out-of-memory exception.

Keep that in mind when you specify the memory requests for the Fluent Bit daemon set. I have used the values from the Azure Monitor Container Insights solution, that by the way uses Fluent Bit as one of its components under the hood. The values are 325Mi for the memory requests and 750Mi for the limits.

Outlook

That is all for part one of the series “Learnings from the field – Running Fluent Bit on Azure Kubernetes Service”.

In the second part, I talk about my learnings regarding log ingestion to Azure Log Analytics. Stay tuned.

Der Beitrag Learnings from the field – Running Fluent Bit on Azure Kubernetes Service – Part 1 erschien zuerst auf Daniel's Tech Blog.

Learnings from the field – Running Fluent Bit on Azure Kubernetes Service – Part 2

$
0
0

This is the second part of a three-part series about “Learnings from the field – Running Fluent Bit on Azure Kubernetes Service”.

-> https://www.danielstechblog.io/learnings-from-the-field-running-fluent-bit-on-azure-kubernetes-service-part-1/

Logging is one of the central aspects when operating Kubernetes. The easiest way to get started with it is by using the solution your cloud provider provides. On Azure, this is Azure Monitor Container Insights that can also be used on Google Kubernetes Engine and Amazon Elastic Kubernetes Service via Azure Arc.

When you look for a platform-agnostic approach that is also highly customizable, you probably end up with Fluent Bit. Besides running Fluent Bit on Kubernetes for your container logs, you can run it on VMs or bare-metal servers for logging. Nevertheless, the focus in this series is on Fluent Bit running on Azure Kubernetes Service and using Azure Log Analytics as the logging backend.

I share with you specific learnings from the field operating Fluent Bit on Azure Kubernetes Service.

Why shall I use filesystem buffering?

When working with Fluent Bit, you control the memory usage of the input plugins with the setting Mem_Buf_Limit. Otherwise, you risk running into an out-of-memory exception in a high-load environment with backpressure.

-> https://docs.fluentbit.io/manual/administration/buffering-and-storage#buffering-and-memory
-> https://docs.fluentbit.io/manual/administration/backpressure

Backpressure can occur when the configured output plugin cannot flush the log data to its destination. Most likely are network issues or the logging backend, in our case Log Analytics, is not available.

So, what happens when you run into a backpressure scenario where the input plugin reaches its Mem_Buf_Limit threshold?

The input plugin pauses the log ingestion, and you might lose log data, especially in the case of the tail plugin when log file rotation occurs. You can prevent that by configuring and using filesystem buffering.

-> https://docs.fluentbit.io/manual/administration/buffering-and-storage#filesystem-buffering-to-the-rescue

The filesystem buffering allows the input plugin in a backpressure scenario to register new log data and store the log chunks on disk rather than in memory. Once the output plugin starts to flush log data to its backend again, the input plugin can process the log data in memory and starts processing the log chunks stored on disk.

By using the Mem_Buf_Limit setting, and file system buffering, you ensure you do not lose log data. Depending on your configuration and the length of an outage of your logging backend, it might be that you still can lose log data.

The configuration of the filesystem buffering is done centrally in the [SERVICE] section of the Fluent Bit configuration. For a minimal configuration using the defaults, set the storage.path in the [SERVICE] section.

...
  fluent-bit.conf: |
    [SERVICE]
        Flush                     15
        Log_Level                 info
        Daemon                    Off
        Parsers_File              parsers.conf
        storage.path              /var/log/flb-storage/
...

In the input plugin configuration set storage.type to filesystem.

...
  input-kubernetes.conf: |
    [INPUT]
        Name              tail
        Alias             logs_input
        Tag               kubernetes.logs.*
        Path              /var/log/containers/*.log
        Parser            cri_kubernetes_logs
        DB                /var/log/flb_kubernetes_log.db
        ...
        Mem_Buf_Limit     10mb
        storage.type      filesystem
...

Losing log data due to output plugin retry configuration

Fluent Bit uses a Scheduler to decide when it is time to flush log data through the configured output plugins. The output plugin will send one of three possible return statuses. OK means the log data has been successfully flushed. An Error status indicates an unrecoverable error, and the log data is lost.

When a Retry status is sent, the Scheduler decides how long the wait time is to retry to flush the log data. Per default, only one retry happens. Can the log data not be flushed again the log data is lost, and Fluent Bit logs the following warning.

...
[2023/01/25 09:11:04] [ warn] [engine] failed to flush chunk '1-1674637849.649241392.flb', retry in 10 seconds: task_id=83, input=logs_input > output=logs_output (out_id=0)
[2023/01/25 09:11:24] [ warn] [engine] chunk '1-1674637849.649241392.flb' cannot be retried: task_id=83, input=logs_input > output=logs_output
...
[2023/01/25 09:13:10] [ warn] [engine] failed to flush chunk '1-1674637886.887525595.flb', retry in 11 seconds: task_id=30, input=storage_backlog.2 > output=logs_output (out_id=0)
[2023/01/25 09:13:31] [ warn] [engine] chunk '1-1674637886.887525595.flb' cannot be retried: task_id=30, input=storage_backlog.2 > output=logs_output
...

Using the default Retry_Limit configuration will result in losing log data in the event of network issues or a backend outage. You configure the Retry_Limit in each output plugin individually. Setting it to no_limits or False Fluent Bit retries to flush the log data till the return status is OK. Otherwise, you specify a number that fits your needs. This can be 10 or 60 whatever is suitable for your use case.

...
  output-kubernetes.conf: |
    [OUTPUT]
        Name            azure
        Alias           logs_output
        Match           kubernetes.logs.*
        ...
        Retry_Limit     10

Give Fluent Bit enough time during a shutdown

Another case where you can lose log data is during a voluntary disruption of the Fluent Bit pod on a node. These voluntary disruptions happen during cluster autoscaler, Kubernetes upgrades, node reboot events, or updating the Fluent Bit daemon set.

Fluent Bit’s own grace period configuration is 5 seconds if not specified otherwise. 5 seconds might be too short when during the final flush, a Retry status is reported by the output plugin. Hence, my recommendation to you configure the grace period via the Grace parameter.

Keep in mind that the default termination grace period for Kubernetes pods is 30 seconds.

For instance, we use a 60-second grace period within Fluent Bit and a 75-second termination grace period in Kubernetes for the daemon set.

Fluent Bit configuration:

...
  fluent-bit.conf: |
    [SERVICE]
        Flush                     15
        Grace                     60
        Log_Level                 info
        Daemon                    Off
        Parsers_File              parsers.conf
        storage.path              /var/log/flb-storage/
...

Kubernetes daemon set configuration:

apiVersion: apps/v1
kind: DaemonSet
metadata:
  name: fluent-bit
  namespace: logging
  ...
spec:
  selector:
    matchLabels:
      app: fluent-bit
  template:
    ...
    spec:
      terminationGracePeriodSeconds: 75
      containers:
      - name: fluent-bit
        image: fluent/fluent-bit:1.9.6
...

Azure Log Analytics’ TimeGenerated field

As mentioned at the beginning, I am using Log Analytics as the logging backend for Fluent Bit. Log Analytics has a TimeGenerated field for every log line that represents the timestamp when this specific log line was ingested into Log Analytics.

For application log data it is crucial that the original timestamp is used by Log Analytics for the TimeGenerated field to make queries a lot easier. The TimeGenerated field is the default field used by Log Analytics to identify log data during a log query for a specific time range.

Fortunately, the Log Analytics API provides the request header field time-generated-field you can use to point Log Analytics to the field in the log data that contains the timestamp to use for the TimeGenerated field.

-> https://learn.microsoft.com/en-us/azure/azure-monitor/logs/data-collector-api?WT.mc_id=AZ-MVP-5000119#request-headers

You must configure the Fluent Bit output plugin specifically to achieve this by setting Time_Generated to on and providing the field name via Time_Key.

-> https://docs.fluentbit.io/manual/pipeline/outputs/azure#configuration-parameters

Below is an example output plugin configuration when you use the CRI parser from the Fluent Bit documentation.

...
  output-kubernetes.conf: |
    [OUTPUT]
        Name            azure
        Alias           logs_output
        Match           kubernetes.logs.*
        ...
        Time_Key        @time
        Time_Generated  on
        Retry_Limit     10

Keep in mind that for log data where the value for the TimeGenerated field is older than two days before the received time, Log Analytics uses the ingestion time for the TimeGenerated field. Under normal circumstances, you shall not run into this edge case. But it depends on the backpressure scenario and your retry configuration.

Outlook

That is all for part two of the series “Learnings from the field – Running Fluent Bit on Azure Kubernetes Service”.

In the third and last part, I talk about the topic of gathering logs of Fluent Bit itself. Stay tuned.

Der Beitrag Learnings from the field – Running Fluent Bit on Azure Kubernetes Service – Part 2 erschien zuerst auf Daniel's Tech Blog.

Change the replication type of an Azure storage account

$
0
0

Last year I wrote a blog post about migrating an Azure storage account from LRS to ZRS replication.

-> https://www.danielstechblog.io/migrate-an-azure-storage-account-from-lrs-to-zrs-replication-without-downtime/

Back then, this procedure required the involvement of Azure support via a support ticket.

Things have changed since then, and now you can initiate the migration yourself. Select the storage account you want to migrate and navigate into the Redundancy section.

Azure portal - storage account redundancy section Azure portal - storage account redundancy section - ZRS selected

You select the new redundancy type and click on Save.

Azure portal - storage account redundancy section - confirm change Azure portal - storage account redundancy section - migration status

A confirmation is needed, and the storage account gets submitted for conversion. The migration is started within 72 hours and can take several days for large storage accounts.

For more details, have a look at the Azure documentation.

-> https://learn.microsoft.com/en-us/azure/storage/common/redundancy-migration?WT.mc_id=AZ-MVP-5000119

Der Beitrag Change the replication type of an Azure storage account erschien zuerst auf Daniel's Tech Blog.


Learnings from the field – Running Fluent Bit on Azure Kubernetes Service – Part 3

$
0
0

This is the second part of a three-part series about “Learnings from the field – Running Fluent Bit on Azure Kubernetes Service”.

-> https://www.danielstechblog.io/learnings-from-the-field-running-fluent-bit-on-azure-kubernetes-service-part-1/
-> https://www.danielstechblog.io/learnings-from-the-field-running-fluent-bit-on-azure-kubernetes-service-part-2/

Logging is one of the central aspects when operating Kubernetes. The easiest way to get started with it is by using the solution your cloud provider provides. On Azure, this is Azure Monitor Container Insights that can also be used on Google Kubernetes Engine and Amazon Elastic Kubernetes Service via Azure Arc.

When you look for a platform-agnostic approach that is also highly customizable, you probably end up with Fluent Bit. Besides running Fluent Bit on Kubernetes for your container logs, you can run it on VMs or bare-metal servers for logging. Nevertheless, the focus in this series is on Fluent Bit running on Azure Kubernetes Service and using Azure Log Analytics as the logging backend.

I share with you specific learnings from the field operating Fluent Bit on Azure Kubernetes Service.

Do I need to gather logs from Fluent Bit?

It is a debatable topic if you should gather logs from Fluent Bit or not as you would do it with Fluent Bit itself. From my experience, the answer is a simple yes. So, let me explain how I came to this conclusion.

First, it does not make sense to have a second tool/service to get logs from your logging tool. It is the same topic as how to monitor your monitoring tool. But back to the topic do I need to gather logs from Fluent Bit.

As I already said the answer is yes. Otherwise, you are unaware of certain things that happen during the operation of Fluent Bit. Without gathering the logs of Fluent Bit, you cannot easily get an alert, for instance, about the situation when you ingest logs without Kubernetes metadata information. I covered that topic in the first part of the series. The log line to trigger an alert for this issue is the following one.

[2023/01/09 20:48:14] [ warn] [http_client] cannot increase buffer: current=32000 requested=64768 max=32000

What limitations exist?

Gathering Fluent Bit log data by Fluent Bit itself has its limits when it comes to the situation to detect issues with log ingestion or losing log data.

It depends on which log chunk those log data get placed in and if this specific log chunk gets flushed successfully to the logging backend.

Even under these circumstances, it is possible to detect issues with log ingestion or losing log data. You should focus on the following six log lines for detecting those kinds of problems.

1.) [2023/03/14 08:04:02] [ info] [input:storage_backlog:storage_backlog.2] register tail.0/1-1678779305.952848590.flb
2.) [2023/03/14 08:04:03] [ info] [input:storage_backlog:storage_backlog.2] queueing tail.0:1-1678779305.952848590.flb
3.) [2023/03/14 08:04:17] [ info] [engine] flush backlog chunk '1-1678779305.952848590.flb' succeeded: task_id=3, input=storage_backlog.2 > output=logs_output (out_id=0)

4.) [2023/03/13 23:54:16] [ info] [engine] flush chunk '1-1678751635.483713953.flb' succeeded at retry 1: task_id=0, input=logs_input > output=logs_output (out_id=0)
5.) [2023/03/13 23:54:10] [ warn] [engine] failed to flush chunk '1-1678751635.483713953.flb', retry in 6 seconds: task_id=0, input=logs_input > output=logs_output (out_id=0)

6.) [2023/03/14 07:22:47] [ warn] [net] getaddrinfo(host='xxxxxxxx-xxxx-xxxx-xxxx-xxxxxxxxxxxx.ods.opinsights.azure.com', err=12): Timeout while contacting DNS servers

The first three focus on the filesystem buffering after a Fluent Bit pod restart or a Kubernetes node reboot to apply security patches or even a Kubernetes node crash following a restart. Counting those log lines independently should result in the same amount when compared to each other.

Azure Workbook - Filesystem buffering

Register means that Fluent Bit is aware of those log chunks in the filesystem buffer. The status queueing represents that the log chunks are ready to be flushed to the logging backend. Finally, when they have been flushed successfully to the logging backend you see the third log line.

Also, for the fourth and fifth log lines, the count should be the same when comparing the results.

Azure Workbook - In memory

The focus here is on log chunks in memory. There are only two states “failed to flush” and “flush succeeded”.

When for whatever reason in both cases, filesystem buffering or in memory, the count differs from each other, you can be assured that you lost some log data.

Another good indication of issues with the log ingestion is the sixth log line. Especially, when your logging backend is addressed via a DNS domain name. A large number of those log lines will correlate with log lines four and five. Where the “failed to flush” count is larger than the “flush succeeded”.

Summary

This was the last part of a three-part series about “Learnings from the field – Running Fluent Bit on Azure Kubernetes Service”.

I hope you got some valuable insights that help you to run Fluent Bit on Azure Kubernetes Service with Azure Log Analytics as the logging backend.

The learnings apply to every other Kubernetes environment where you run Fluent Bit on. Even the focus in this series was on Azure Kubernetes Service and Azure Log Analytics.

Der Beitrag Learnings from the field – Running Fluent Bit on Azure Kubernetes Service – Part 3 erschien zuerst auf Daniel's Tech Blog.

Using Kata Containers on Azure Kubernetes Service for sandboxing containers

$
0
0

Last year I wrote a blog post about running gVisor on Azure Kubernetes for sandboxing containers.

-> https://www.danielstechblog.io/running-gvisor-on-azure-kubernetes-service-for-sandboxing-containers/

Back then, the only managed Kubernetes service that supported sandboxing containers in dedicated node pools was Google Kubernetes Engine via gVisor.

A few weeks back, Microsoft announced the public preview of Kata Containers for Azure Kubernetes Service.

-> https://techcommunity.microsoft.com/t5/apps-on-azure-blog/preview-support-for-kata-vm-isolated-containers-on-aks-for-pod/ba-p/3751557?WT.mc_id=AZ-MVP-5000119

Enable Kata Containers

Before we can use Kata Containers in our Azure Kubernetes Service cluster, we need to install and enable a couple of prerequisites following the Azure documentation.

-> https://learn.microsoft.com/en-us/azure/aks/use-pod-sandboxing?WT.mc_id=AZ-MVP-5000119#prerequisites

Afterward, we create a new node pool. The new node pool receives a label and a taint as we want the node pool to be exclusively available for untrusted workloads using Kata Containers.

az aks nodepool add --cluster-name $AKS_CLUSTER_NAME --resource-group $AKS_CLUSTER_RG \
  --name kata --os-sku mariner --workload-runtime KataMshvVmIsolation --node-vm-size Standard_D4s_v3 \
  --node-taints kata=enabled:NoSchedule --labels kata=enabled

Azure portal - AKS cluster node pools Azure portal - AKS cluster node pool kata configuration details

Once the node pool is ready, we run the following command checking the available runtimes.

> kubectl get runtimeclasses.node.k8s.io
NAME                     HANDLER   AGE
kata-mshv-vm-isolation   kata      54m
runc                     runc      54m

We see two runtimes runc the default one for trusted workloads and the new kata-mshv-vm-isolation for untrusted workloads that uses Kata Containers.

Verify Kata Containers usage

We deploy the following pod template that deploys an NGINX proxy onto the Kata Containers node pool.

apiVersion: v1
kind: Pod
metadata:
  name: nginx-kata
spec:
  containers:
  - name: nginx
    image: nginx
  runtimeClassName: kata-mshv-vm-isolation
  tolerations:
    - key: kata
      operator: Equal
      value: "enabled"
      effect: NoSchedule
  nodeSelector:
    kata: enabled

Noteworthy is the definition of the runtime class as otherwise, Kubernetes uses runc, the default runtime. Furthermore, for completeness, we specify the toleration and the node selector.

> kubectl get pods nginx-kata -o wide
NAME         READY   STATUS    RESTARTS   AGE   IP            NODE                           NOMINATED NODE   READINESS GATES
nginx-kata   1/1     Running   0          15s   10.240.3.40   aks-kata-24023092-vmss000000   <none>           <none>

After deploying our NGINX pod, we verify if the pod is sandboxed via Kata Containers. Hence, we do an exec into the NGINX proxy pod and execute the installation of ping.

> kubectl exec -it nginx-gvisor -- /bin/sh
> apt update && apt install iputils-ping -y
...
Setting up iputils-ping (3:20210202-1) ...
Failed to set capabilities on file `/bin/ping' (Operation not supported)
The value of the capability argument is not permitted for a file. Or the file is not a regular (non-symlink) file
Setcap failed on /bin/ping, falling back to setuid
...

The installation succeeds, but the set of required capabilities fails as we run in a sandbox provided by Kata Containers. Using the default runc runtime we will not see this error message as the NGINX proxy pod will not be running in a sandbox.

Summary

Finally, we can run untrusted workloads on Azure Kubernetes Service without installing another secure container runtime manually.

During the public preview, we can reduce the impact on a production cluster by using a dedicated node pool for Kata Containers.

Der Beitrag Using Kata Containers on Azure Kubernetes Service for sandboxing containers erschien zuerst auf Daniel's Tech Blog.

Azure Kubernetes Service news from KubeCon Europe 2023

$
0
0

Last month the KubeCon + CloudNativeCon Europe took place in Amsterdam with a lot of news regarding Azure Kubernetes Service. Let us now walk through some of the highlights that have been announced for Azure Kubernetes Service.

A lot of networking news has been made at KubeCon Europe. Starting with the general availability of the Azure CNI Overlay feature that addresses the IP address exhaustion issue that is present with the traditional Azure CNI plugin.

-> https://azure.microsoft.com/en-us/updates/azurecnioverlay?WT.mc_id=AZ-MVP-5000119
-> https://learn.microsoft.com/en-us/azure/aks/azure-cni-overlay?WT.mc_id=AZ-MVP-5000119

Besides that Istio is now available in public preview as an AKS add-on which means you get a managed Istio on Azure Kubernetes Service.

-> https://azure.microsoft.com/en-us/updates/public-preview-aks-service-mesh-addon-for-istio?WT.mc_id=AZ-MVP-5000119
-> https://techcommunity.microsoft.com/t5/apps-on-azure-blog/istio-based-service-mesh-add-on-for-azure-kubernetes-service/ba-p/3800229?WT.mc_id=AZ-MVP-5000119
-> https://learn.microsoft.com/en-us/azure/aks/istio-deploy-addon?WT.mc_id=AZ-MVP-5000119

Another milestone has been the announcement of the public preview of Cilium Enterprise via the Azure Marketplace. Cilium Enterprise can be installed with just a few clicks on new Azure Kubernetes Service clusters or existing Azure Kubernetes Service clusters running Azure CNI powered by Cilium.

-> https://azure.microsoft.com/en-us/updates/ciliumenterpriseonazuremarketplace?WT.mc_id=AZ-MVP-5000119
-> https://isovalent.com/blog/post/isovalent-cilium-enterprise-microsoft-azure-marketplace/

Long awaited and now finally generally available is Azure Active Directory Workload Identity for Azure Kubernetes Service. AAD Workload Identity enables Kubernetes pods to securely access Azure services in your subscription.

-> https://azure.microsoft.com/en-us/updates/ga-azure-active-directory-workload-identity-with-aks-2?WT.mc_id=AZ-MVP-5000119
-> https://techcommunity.microsoft.com/t5/apps-on-azure-blog/general-availability-for-azure-active-directory-ad-workload/ba-p/3798292?WT.mc_id=AZ-MVP-5000119
-> https://learn.microsoft.com/en-us/azure/aks/workload-identity-overview?WT.mc_id=AZ-MVP-5000119

A very interesting approach that I would have rather seen driven by the community itself is Microsoft’s approach offering long-term support for Kubernetes versions in Azure Kubernetes Service.

-> https://azure.microsoft.com/en-us/updates/generally-available-long-term-support-version-in-aks?WT.mc_id=AZ-MVP-5000119
-> https://techcommunity.microsoft.com/t5/apps-on-azure-blog/azure-kubernetes-upgrades-and-long-term-support/ba-p/3782789?WT.mc_id=AZ-MVP-5000119

Other highlights have been the announcement of the OpenCost integration, Kata confidential containers, and the general availability of Kubernetes 1.26 on Azure Kubernetes Service.

-> https://azure.microsoft.com/en-us/updates/opencost-for-aks-cost-visibility?WT.mc_id=AZ-MVP-5000119
-> https://techcommunity.microsoft.com/t5/apps-on-azure-blog/leverage-opencost-on-azure-kubernetes-service-to-understand-and/ba-p/3796813?WT.mc_id=AZ-MVP-5000119
-> https://techcommunity.microsoft.com/t5/azure-confidential-computing/aligning-with-kata-confidential-containers-to-achieve-zero-trust/ba-p/3797876?WT.mc_id=AZ-MVP-5000119
-> https://azure.microsoft.com/en-us/updates/generally-available-kubernetes-126-support-in-aks?WT.mc_id=AZ-MVP-5000119

As I attended KubeCon + CloudNativeCon Europe in person one of my highlights in the context of Kubernetes in general was the keynote presentation by Microsoft about the KEDA sustainable autoscaler implementation. You can watch the recording here.

-> https://kccnceu2023.sched.com/event/1HyPo

Der Beitrag Azure Kubernetes Service news from KubeCon Europe 2023 erschien zuerst auf Daniel's Tech Blog.

Configuring Istio using the Kubernetes Gateway API

$
0
0

The Kubernetes Gateway API is the successor of the Kubernetes Ingress API and is currently in beta state. More and more projects add support for the Gateway API like Istio.

-> https://istio.io/latest/blog/2022/gateway-api-beta/
-> https://istio.io/latest/blog/2022/getting-started-gtwapi/

In today’s blog post, I walk you through how to configure Istio using the Kubernetes Gateway API. At the time of writing, I am running my Azure Kubernetes Service cluster with Kubernetes version 1.25.6. The Istio version is 1.17.2 and the Gateway API version is 0.6.2.

 Scenario

I cover the following scenarios with my Gateway API configuration for Istio. First, the Istio ingress gateway gets created in the istio-system namespace. Same as with the standard Istio installation. Second, the routing configuration is placed into a dedicated namespace called istio-config to separate the Istio installation from the configuration of the service routing. The last scenario is the automatic redirection of HTTP traffic to HTTPS.

Install Kubernetes Gateway API CRDs

Before we can use the Gateway API on an Azure Kubernetes Service cluster, we must install the Gateway API CRDs. In total, we install four custom resource definitions, short CRDs. The GatewayClass, Gateway, HTTPRoute, and ReferenceGrant.

GATEWAY_API_TAG='v0.6.2'
 kubectl apply -f "https://raw.githubusercontent.com/kubernetes-sigs/gateway-api/$GATEWAY_API_TAG/config/crd/standard/gateway.networking.k8s.io_gatewayclasses.yaml"
 kubectl apply -f "https://raw.githubusercontent.com/kubernetes-sigs/gateway-api/$GATEWAY_API_TAG/config/crd/standard/gateway.networking.k8s.io_gateways.yaml"
 kubectl apply -f "https://raw.githubusercontent.com/kubernetes-sigs/gateway-api/$GATEWAY_API_TAG/config/crd/standard/gateway.networking.k8s.io_httproutes.yaml"
 kubectl apply -f "https://raw.githubusercontent.com/kubernetes-sigs/gateway-api/$GATEWAY_API_TAG/config/crd/standard/gateway.networking.k8s.io_referencegrants.yaml"

When you follow the Istio documentation and use the kustomize command, you only install three CRDs. The ResourceGrant CRD is not part of the kustomize template but required to fulfill our second scenario.

-> https://istio.io/latest/docs/tasks/traffic-management/ingress/gateway-api/

Set up the Istio ingress gateway

After the CRD installation, we proceed with the definition to configure the Istio ingress gateway. The gateway configuration is kept simple and consists of the two required spec sections gatewayClassName and listeners.

apiVersion: gateway.networking.k8s.io/v1beta1
kind: Gateway
metadata:
  name: gw-api
  namespace: istio-system
spec:
  gatewayClassName: istio
  listeners:
  ...

For the gatewayClassName, we use istio as this is the name of the GatewayClass resource in our case.

❯ kubectl get gatewayclasses.gateway.networking.k8s.io
NAME    CONTROLLER                    ACCEPTED   AGE
istio   istio.io/gateway-controller   True       9d

We define two listeners, one for HTTP and one for HTTPS traffic.

...
    - name: http
      hostname: "*.danielstechblog.de"
      port: 80
      protocol: HTTP
      allowedRoutes:
        namespaces:
          from: Same
        kinds:
          - group: gateway.networking.k8s.io
            kind: HTTPRoute
...

The one for HTTP traffic restricts the route configuration to the same namespace in which the Istio ingress gateway gets deployed. We will talk about the why in the section about the HTTP to HTTPS traffic redirection. Also, the route configuration is restricted to the kind HTTPRoute.

Allowed routes can be configured beside the value Same with two other values. All to allow route configuration from every namespace or Selector to allow them only from namespaces with a specific label as seen in the HTTPS listener configuration below.

...
    - name: https
      hostname: "*.danielstechblog.de"
      port: 443
      protocol: HTTPS
      allowedRoutes:
        namespaces:
          from: Selector
          selector:
            matchLabels:
              ingress-configuration: "true"
        kinds:
          - group: gateway.networking.k8s.io
            kind: HTTPRoute
      tls:
        mode: Terminate
        certificateRefs:
          - kind: Secret
            group: ""
            name: istio-ingress-cert
            namespace: istio-system

The HTTPS listener configuration has an additional tls section for the HTTPS configuration. Which mode should be used, Terminate or Passthrough? Furthermore, we specify at least one certificate reference. Per default, the certificate reference uses the same namespace as the ingress gateway.

Currently, the Istio ingress gateway deployed by the Kubernetes Gateway API runs only with one replica. We must deploy a horizontal pod autoscaler and a pod disruption budget resource having the same configuration as the default Istio ingress gateway.

apiVersion: autoscaling/v2
kind: HorizontalPodAutoscaler
metadata:
  name: gw-api
spec:
  scaleTargetRef:
    apiVersion: apps/v1
    kind: Deployment
    name: gw-api-istio
  minReplicas: 3
  maxReplicas: 6
  metrics:
    - type: Resource
      resource:
        name: cpu
        target:
          type: Utilization
          averageUtilization: 80
---
apiVersion: policy/v1
kind: PodDisruptionBudget
metadata:
  name: gw-api
spec:
  minAvailable: 50%
  selector:
    matchLabels:
      istio.io/gateway-name: gw-api

Adding those additional resources ensures a highly available ingress gateway.

Configure HTTP routing

Let us start with the routing configuration for the HTTP to HTTPS redirect.

apiVersion: gateway.networking.k8s.io/v1beta1
kind: HTTPRoute
metadata:
  name: http-to-https-redirect
  namespace: istio-system
spec:
  parentRefs:
    - name: gw-api
      namespace: istio-system
  hostnames:
    - "*.danielstechblog.de"
  rules:
    - filters:
        - type: RequestRedirect
          requestRedirect:
            scheme: https
            statusCode: 301
            port: 443

The routing configuration is attached with a parent reference to the respective ingress gateway. Under the rules section, the actual configuration happens how traffic is handled.

In the case of the redirect, we use a filter of type RequestRedirect. Even we use the scheme https, we must specify the port, 443, as otherwise, the redirect uses port 80.

HTTP redirect configuration error

❯ curl -sIL http://gwapi.danielstechblog.de
HTTP/1.1 301 Moved Permanently
location: https://gwapi.danielstechblog.de:80/
date: Thu, 18 May 2023 21:02:14 GMT
server: istio-envoy
transfer-encoding: chunked

Now the explanation of why we restrict the routing configuration of the HTTP listener to the istio-system namespace or in general, to a dedicated namespace. For instance, using All or placing the redirect routing configuration into the same namespace as the other configurations and using the Selector option would allow HTTP traffic to the services directly instead of redirecting traffic from HTTP to HTTPS.

❯ curl -sIL http://gwapi.danielstechblog.de
HTTP/1.1 200 OK
date: Thu, 18 May 2023 20:56:17 GMT
content-length: 107
content-type: text/html; charset=utf-8
x-envoy-upstream-service-time: 8
server: istio-envoy

Using a dedicated namespace lets the redirect work as intended.

❯ curl -sIL http://gwapi.danielstechblog.de
HTTP/1.1 301 Moved Permanently
location: https://gwapi.danielstechblog.de:443/
date: Thu, 18 May 2023 20:51:18 GMT
server: istio-envoy
transfer-encoding: chunked

HTTP/2 200
date: Thu, 18 May 2023 20:51:18 GMT
content-length: 107
content-type: text/html; charset=utf-8
x-envoy-upstream-service-time: 5
server: istio-envoy

After putting the redirect into place, we continue our routing configuration, enabling our application to receive traffic.

apiVersion: gateway.networking.k8s.io/v1beta1
kind: HTTPRoute
metadata:
  name: go-webapp
  namespace: istio-config
spec:
  parentRefs:
    - name: gw-api
      namespace: istio-system
  hostnames:
    - "*.danielstechblog.de"
  rules:
    - backendRefs:
        - name: go-webapp-gw-api
          namespace: go-webapp
          port: 80

The routing configuration for our application is deployed, as mentioned in the scenarios, to a namespace called istio-config. We use a backend reference under the rules section to direct traffic to our application. Directing traffic to the root path / does not require anything else in this case.

Besides the routing configuration, we need a ReferenceGrant resource in the application namespace, as the routing configuration lives in a different namespace than our application.

apiVersion: gateway.networking.k8s.io/v1beta1
kind: ReferenceGrant
metadata:
  name: go-webapp
  namespace: go-webapp
spec:
  from:
    - group: gateway.networking.k8s.io
      kind: HTTPRoute
      namespace: istio-config
  to:
    - group: ""
      kind: Service
      name: go-webapp-gw-api

A reference grant allows the backend reference from a routing configuration that lives in a different namespace. We can specify in the to section if we want to allow the backend reference to all Kubernetes service objects or only a specific one like go-webapp-gw-api in the example above.

Can I run Istio in both modes in parallel?

Istio supports running both modes in parallel. As long as we have specified the Istio ingress gateway in our IstioOperator template, we will get it deployed and can add an Istio ingress gateway via the Kubernetes Gateway API besides the default one.

Istio using both modes. Default and Kubernetes Gateway API

In the screenshot above we see an Istio installation using both modes in parallel on the same Kubernetes cluster.

The application served by the Istio ingress gateway deployed via the Gateway API is presented on the left side and returns a red page. Vice versa, on the right side, we see the application served by the default Istio ingress gateway, returning a blue page.

Summary

Setting up and configuring the Istio ingress gateway via the Kubernetes Gateway API is straightforward. Yes, some quirks need to be considered like the horizontal pod autoscaler and the pod disruption budget. But the Gateway API looks very promising to be the standard in the future for ingress configuration as well as for the service mesh configuration which is currently driven by the GAMMA initiative. Hence, you should give it a try and get familiar with the Kubernetes Gateway API whether you are using Istio or not.

You can find my configuration examples in my GitHub repository.

-> https://github.com/neumanndaniel/kubernetes/tree/master/gateway-api

Additional resources about the Kubernetes Gateway API are linked below.

-> https://kubernetes.io/blog/2022/07/13/gateway-api-graduates-to-beta/
-> https://gateway-api.sigs.k8s.io/
-> https://gateway-api.sigs.k8s.io/contributing/gamma/
-> https://github.com/kubernetes-sigs/gateway-api

Der Beitrag Configuring Istio using the Kubernetes Gateway API erschien zuerst auf Daniel's Tech Blog.

How to not block Terraform with Azure resource locks

$
0
0

Azure resource locks are an essential building block protecting Azure resources from accidental deletion or modifications.

In today’s blog post, I show you how to use Azure resource locks to protect your Azure resources and how to not block your Terraform infrastructure as code processes.

Common setup and the Terraform issue

Resources in Azure inherit the resource lock from their parent resource. Therefore, in most setups, a resource lock is created either on the resource group or the resource itself. In such a setup, you cannot leverage Terraform to its fullest, as delete operations are blocked by the resource lock. Which is intended as we want to prevent accidental deletions.

The following example shows the setup for a resource lock on an Azure DNS zone where we can only add DNS records. But we cannot delete DNS records that we do not need anymore.

resource "azurerm_resource_group" "rg" {
  name     = "resource-locks"
  location = "northeurope"
}

resource "azurerm_dns_zone" "zone" {
  name                = "locks.local"
  resource_group_name = azurerm_resource_group.rg.name
}

resource "azurerm_management_lock" "rg" {
  name       = "resource-group-lock"
  scope      = azurerm_resource_group.rg.id
  lock_level = "CanNotDelete"
}

resource "azurerm_dns_cname_record" "cname" {
  name                = "test"
  zone_name           = azurerm_dns_zone.zone.name
  resource_group_name = azurerm_resource_group.rg.name
  ttl                 = 300
  record              = "locks.local"
}

Azure portal - resource lock on resource group

When we try to delete the record, we retrieve the following error message.

resource "azurerm_resource_group" "rg" {
  name     = "resource-locks"
  location = "northeurope"
}

resource "azurerm_dns_zone" "zone" {
  name                = "locks.local"
  resource_group_name = azurerm_resource_group.rg.name
}

resource "azurerm_management_lock" "rg" {
  name       = "resource-group-lock"
  scope      = azurerm_resource_group.rg.id
  lock_level = "CanNotDelete"
}

# resource "azurerm_dns_cname_record" "cname" {
#   name                = "test"
#   zone_name           = azurerm_dns_zone.zone.name
#   resource_group_name = azurerm_resource_group.rg.name
#   ttl                 = 300
#   record              = "locks.local"
# }
Error: deleting Record Type (
  Subscription: "<subscription_id>"
  Resource Group Name: "resource-locks"
  Dns Zone Name: "locks.local"
  Record Type: "CNAME"
  Relative Record Set Name: "test"
): unexpected status 409 with error: ScopeLocked: The scope '/subscriptions/<subscription_id>/resourceGroups/resource-locks/providers/Microsoft.Network/dnsZones/locks.local/CNAME/test' cannot perform delete operation because following scope(s) are locked: '/subscriptions/<subscription_id>/resourceGroups/resource-locks'. Please remove the lock and try again.

How can we use Terraform to its fullest and still protect the Azure resource and the resource group from accidental deletion?

Using resource locks on child resources

The solution is quite simple: moving the resource lock down the inheritance chain to the end. Instead of putting the resource lock on the resource group or parent resource level, we set it on the child resource.

Understandably, why should this protect the resource group and the parent resource from accidental deletion?

It has something to do with how resource deletion works in Azure. Before a resource group and all its containing child resources are deleted a check is done, if a resource lock exists or not. When a resource lock exists, the deletion gets canceled, and an error message is returned like the one below.

Azure portal - resources in resource group

❯ az group delete --name resource-locks --yes
(ScopeLocked) The scope '/subscriptions/<subscription_id>/resourcegroups/resource-locks' cannot perform delete operation because following scope(s) are locked: '/subscriptions/<subscription_id>/resourceGroups/resource-locks/providers/Microsoft.Network/dnsZones/locks.local/TXT/delete-protected'. Please remove the lock and try again.
Code: ScopeLocked
Message: The scope '/subscriptions/<subscription_id>/resourcegroups/resource-locks' cannot perform delete operation because following scope(s) are locked: '/subscriptions/<subscription_id>/resourceGroups/resource-locks/providers/Microsoft.Network/dnsZones/locks.local/TXT/delete-protected'. Please remove the lock and try again.

It is only applicable to the Azure portal, Azure CLI, etc. When you use Terraform’s destroy option, Terraform deletes the resources according to its dependency tree.

That brings us to the point I have not clarified at the beginning. Accidental deletion means manual resource deletion by a human individual using the Azure portal or Azure CLI.

Unblock Terraform infrastructure as code processes

Let us start to unblock Terraform by using resource locks on child resources. Below is our adjusted example where we set the resource lock on a dummy DNS record instead of the resource group.

resource "azurerm_resource_group" "rg" {
  name     = "resource-locks"
  location = "northeurope"
}

resource "azurerm_dns_zone" "zone" {
  name                = "locks.local"
  resource_group_name = azurerm_resource_group.rg.name
}

resource "azurerm_dns_cname_record" "cname" {
  name                = "test"
  zone_name           = azurerm_dns_zone.zone.name
  resource_group_name = azurerm_resource_group.rg.name
  ttl                 = 300
  record              = "locks.local"
}

resource "azurerm_dns_txt_record" "txt" {
  name                = "delete-protected"
  zone_name           = azurerm_dns_zone.zone.name
  resource_group_name = azurerm_resource_group.rg.name
  ttl                 = 300

  record {
    value = "delete-protected"
  }
}

resource "azurerm_management_lock" "rg" {
  name       = "child-resource-lock"
  scope      = azurerm_dns_txt_record.txt.id
  lock_level = "CanNotDelete"
}

Azure portal - resource lock on child resource

Now we can delete the DNS record with Terraform without being blocked by the resource lock and still protecting the DNS zone from accidental deletion.

resource "azurerm_resource_group" "rg" {
  name     = "resource-locks"
  location = "northeurope"
}

resource "azurerm_dns_zone" "zone" {
  name                = "locks.local"
  resource_group_name = azurerm_resource_group.rg.name
}

# resource "azurerm_dns_cname_record" "cname" {
#   name                = "test"
#   zone_name           = azurerm_dns_zone.zone.name
#   resource_group_name = azurerm_resource_group.rg.name
#   ttl                 = 300
#   record              = "locks.local"
# }

resource "azurerm_dns_txt_record" "txt" {
  name                = "delete-protected"
  zone_name           = azurerm_dns_zone.zone.name
  resource_group_name = azurerm_resource_group.rg.name
  ttl                 = 300

  record {
    value = "delete-protected"
  }
}

resource "azurerm_management_lock" "rg" {
  name       = "child-resource-lock"
  scope      = azurerm_dns_txt_record.txt.id
  lock_level = "CanNotDelete"
}
Plan: 0 to add, 0 to change, 1 to destroy.
azurerm_dns_cname_record.cname: Destroying... [id=/subscriptions/<subscription_id>/resourceGroups/resource-locks/providers/Microsoft.Network/dnsZones/locks.local/CNAME/test]
azurerm_dns_cname_record.cname: Destruction complete after 1s

Apply complete! Resources: 0 added, 0 changed, 1 destroyed.

Azure portal - DNS zone deletion denied

The Azure DNS zone was only one example. Many Azure resources have child resources like Azure Database for PostgreSQL or Azure Data Explorer, where we can use this approach.

Azure resources without child resources still get the resource lock directly, for instance, an Azure Log Analytics workspace.

Summary

Unblocking Terraform requires a change in your resource lock design by moving them down the inheritance chain onto child resources.

Whether you do it or not depends on your strategy. The benefit of doing so is using Terraform to its fullest and protecting parent resources from accidental deletion.

Der Beitrag How to not block Terraform with Azure resource locks erschien zuerst auf Daniel's Tech Blog.

Viewing all 181 articles
Browse latest View live