Azure Data Explorer can be used as a logging backend for Fluent Bit in three different ways. In today’s blog post, we focus on one of them that in my opinion is the best one out of those three.
This is the way
Let us start first with a brief overview of the three different solutions and why I have chosen the not-so-obvious one. In my last blog post, I already talked about two of them: Azure Storage and Azure Event Hub. Not particularly for Fluent Bit but as ingestion methods for Azure Data Explorer.
-> https://www.danielstechblog.io/ingesting-azure-diagnostic-logs-into-azure-data-explorer/
Before we cover those two options let us look into the first option that comes to our mind looking into Fluent Bit’s output plugin offerings. There is a native output plugin for Azure Data Explorer.
-> https://docs.fluentbit.io/manual/pipeline/outputs/azure_kusto
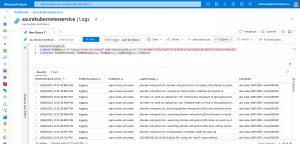
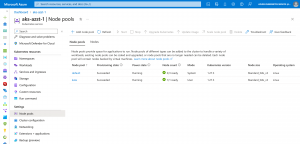
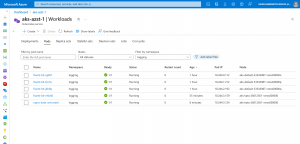
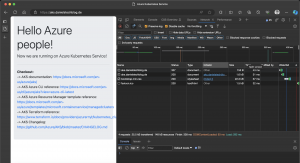
The Azure Data Explorer output plugin uses the queued ingestion method which can be optimized by applying a batch ingestion policy. If a 10-second ingestion delay for your logs is acceptable then the Azure Data Explorer output plugin is the best option. During my tests, I found out that the core oauth2 implementation in Fluent Bit is not always working as expected. Especially, when you restart Fluent Bit pods on Kubernetes. For instance, on my three-node Azure Kubernetes Service cluster two Fluent Bit pods were working after the initial deployment. The version I used for my tests was Fluent Bit 3.0.7.
[2024/07/02 06:50:18] [ info] [output:azure_kusto:azure_kusto.0] endpoint='https://ingest-adxaks.northeurope.kusto.windows.net', database='Kubernetes', table='FluentBitLogs'
[2024/07/02 06:50:32] [ info] [output:azure_kusto:azure_kusto.0] loading kusto ingestion resourcs
[2024/07/02 06:50:32] [ info] [oauth2] HTTP Status=200
[2024/07/02 06:50:32] [ info] [oauth2] access token from 'login.microsoftonline.com:443' retrieved
The other one was stuck in the following state.
[2024/07/02 06:50:18] [ info] [output:azure_kusto:azure_kusto.0] endpoint='https://ingest-adxaks.northeurope.kusto.windows.net', database='Kubernetes', table='FluentBitLogs'
[2024/07/02 06:50:32] [ info] [output:azure_kusto:azure_kusto.0] loading kusto ingestion resourcs
After simulating several restarts of the Fluent Bit pods, all ended up in this stuck state. Unfortunately, I have not had the time to dive deeper into this or open a GitHub issue on the project’s repository. That said you should keep that in mind when you choose the Azure Data Explorer output plugin.
Another option is the Azure Blob output plugin which is officially developed by Microsoft.
-> https://docs.fluentbit.io/manual/pipeline/outputs/azure_blob
I already highlighted in my above-mentioned blog post that the Azure Storage Account option gets expensive when a lot of files are written and read from the Storage Account due to transaction costs. Especially, with a lot of pods running in a Kubernetes cluster, the costs will explode.
Here is a small example from my three-node Azure Kubernetes Service cluster with only running a small number of pods.
![Azure Storage Account Insights]()
Within four hours I had 25.000 transactions in total. Now imagine a couple of large Kubernetes clusters emit their container logs to an Azure Storage Account. Besides that, the Storage Account option requires an Event Grid and Event Hub to get the container logs into Azure Data Explorer.
Therefore, the only viable option to get container logs from Fluent Bit into Azure Data Explorer is the usage of the Kafka output plugin.
-> https://docs.fluentbit.io/manual/pipeline/outputs/kafka
The Kafka output plugin gets connected to an Azure Event Hub as Event Hub provides an Apache Kafka endpoint. Using the Event Hub option for the Azure Data Explorer ingestion allows us to enable the streaming ingestion into Azure Data Explorer for container logs we gather with Fluent Bit. Streaming ingestion allows a near real-time ingestion.
Let us start with the Azure Data Explorer and Fluent Bit configuration.
Prepare Azure Data Explorer for Fluent Bit
As mentioned, before we use the Kafka output plugin in Fluent Bit to get our container logs via Event Hub into Azure Data Explorer.
Now, we begin with the Azure Data Explorer configuration. Our first step is the provisioning of a new database in our Azure Data Explorer cluster, which is called Kubernetes with the default settings.
-> https://learn.microsoft.com/en-us/azure/data-explorer/create-cluster-and-database?WT.mc_id=AZ-MVP-5000119&tabs=full#create-a-database
Once created, we open the query editor to prepare the table for the container logs that match the configured output of Fluent Bit.
.create table ContainerLogs (
    TimeGenerated: datetime, Region: string, PodNamespace: string, PodName: string, ContainerName: string, LogSource: string, LogMessage: dynamic,
    ContainerImage: string, ContainerImageDigest: string, PodId: guid, ContainerId: string,
    Environment: string, Cluster: string, Computer: string, NodeIp: string
    )
![Azure Data Explorer Table]()
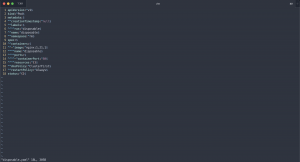
The next step is the ingestion mapping to ensure a correct ingestion into the table.
.create-or-alter table ContainerLogs ingestion json mapping "FluentBitMapping"
    ```[
    {"column": "TimeGenerated", "datatype": "datetime", "Properties": {"Path": "$.TimeGenerated"}},
    {"column": "Region", "datatype": "string", "Properties": {"Path": "$.Region"}},
    {"column": "PodNamespace", "datatype": "string", "Properties": {"Path": "$.PodNamespace"}},
    {"column": "PodName", "datatype": "string", "Properties": {"Path": "$.PodName"}},
    {"column": "ContainerName", "datatype": "string", "Properties": {"Path": "$.ContainerName"}},
    {"column": "LogSource", "datatype": "string", "Properties": {"Path": "$.LogSource"}},
    {"column": "LogMessage", "datatype": "dynamic", "Properties": {"Path": "$.LogMessage"}},
    {"column": "ContainerImage", "datatype": "string", "Properties": {"Path": "$.ContainerImage"}},
    {"column": "ContainerImageDigest", "datatype": "string", "Properties": {"Path": "$.ContainerImageDigest"}},
    {"column": "PodId", "datatype": "guid", "Properties": {"Path": "$.PodId"}},
    {"column": "ContainerId", "datatype": "string", "Properties": {"Path": "$.ContainerId"}},
    {"column": "Environment", "datatype": "string", "Properties": {"Path": "$.Environment"}},
    {"column": "Cluster", "datatype": "string", "Properties": {"Path": "$.Cluster"}},
    {"column": "Computer", "datatype": "string", "Properties": {"Path": "$.Computer"}},
    {"column": "NodeIp", "datatype": "string", "Properties": {"Path": "$.NodeIp"}}
    ]```
Using Event Hub for the Azure Data Explorer ingestion allows us to enable streaming ingestion for near real-time ingestion. Hence, we enable the streaming ingestion policy for the whole Kubernetes database.
.alter database Kubernetes policy streamingingestion enable
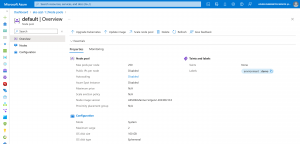
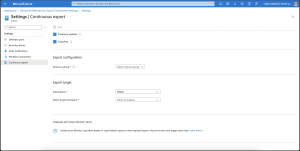
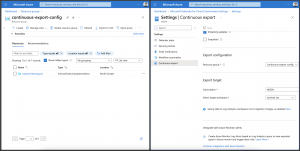
After provisioning the table for the data ingestion, we create the necessary data connection between Event Hub and the Azure Data Explorer database.
![Azure Data Explorer Event Hub Data Connection]()
-> https://learn.microsoft.com/en-us/azure/data-explorer/create-event-hubs-connection?WT.mc_id=AZ-MVP-5000119&tabs=portalADX%2Cget-data-2
As seen in the screenshot, we provide a name for the data connection and select the appropriate Event Hub. The compression setting is kept with its default setting None. Furthermore, we provide the table name with the corresponding ingestion mapping. Last but not least, we select the managed identity type for the data connection. In our case, from type system-assigned.
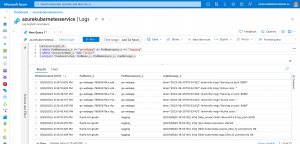
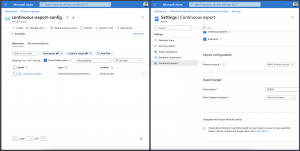
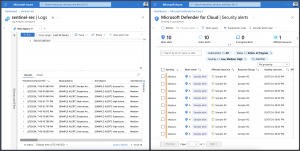
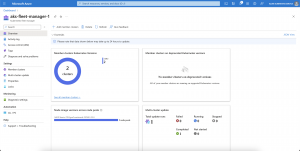
Once the data connection has been created, we can monitor the connection and see how many events have been received and processed when we start to send container logs with Fluent Bit via the Kafka output plugin.
![Azure Data Explorer Event Hub Data Connection Monitor]()
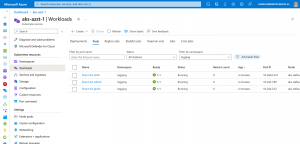
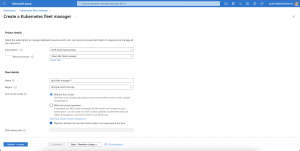
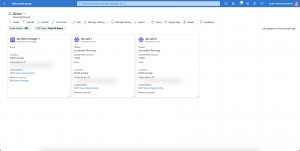
The Event Hub Namespace was created upfront with an Event Hub called Kubernetes with 8 partitions and an enabled auto-inflate functionality for the Event Hub throughput units.
![Azure Event Hub]()
For a production environment, I would set the partition count to the max value of 32 partitions.
Configure Fluent Bit
The entire Fluent Bit configuration is available on my GitHub repository under the following link.
-> https://github.com/neumanndaniel/kubernetes/tree/master/fluent-bit/azure-data-explorer
Instead, we focus on the two filters after the kubernetes filter to prepare the container logs and transfer them into the correct key format that matches the Azure Data Explorer ingestion mapping. Afterward, the configuration of the Kafka output plugin follows.
...
    [FILTER]
        Name         nest
        Alias        logs_filter_2
        Match        kubernetes.logs.*
        Operation    lift
        Nested_under kubernetes
        Add_prefix   kubernetes_
...
The first filter that follows the kubernetes filter is the nest filter that makes Kubernetes pod metadata information under the prefix kubernetes_ available.
...
    [FILTER]
        Name   modify
        Alias  logs_filter_3
        Match  kubernetes.logs.*
        Add    Cluster                    ${CLUSTER}
        Add    Region                     ${REGION}
        Add    Environment                ${ENVIRONMENT}
        Add    NodeIp                     ${NODE_IP}
        Rename time                       TimeGenerated
        Rename message                    LogMessage
        Rename kubernetes_pod_name        PodName
        Rename kubernetes_namespace_name  PodNamespace
        Rename kubernetes_container_image ContainerImage
        Rename kubernetes_container_hash  ContainerImageDigest
        Rename kubernetes_docker_id       ContainerId
        Rename kubernetes_container_name  ContainerName
        Rename kubernetes_pod_id          PodId
        Rename kubernetes_host            Computer
        Rename stream                     LogSource
        Remove logtag
...
We then use the modify filter to add additional keys to the log output and rename existing keys to match the Azure Data Explorer ingestion mapping. Configuration placeholders like ${CLUSTER} are environment variables passed into the Fluent Bit pod via the daemon set configuration as seen in the below snippet.
...
          env:
            - name: FLUENT_BIT_EVENT_HUB_NAMESPACE
              valueFrom:
                secretKeyRef:
                  name: azureeventhub
                  key: namespace
            - name: FLUENT_BIT_EVENT_HUB
              valueFrom:
                secretKeyRef:
                  name: azureeventhub
                  key: topic
            - name: FLUENT_BIT_EVENT_HUB_CONNECTION_STRING
              valueFrom:
                secretKeyRef:
                  name: azureeventhub
                  key: connection_string
...
Before we dive deeper into the Kafka output plugin we generate a new shared access policy for our Kubernetes Event Hub.
![Azure Event Hub Shared Access Policy]()
Using the shared access policy of the Event Hub and not of the entire Event Hub Namespace allows us to restrict Fluent Bit’s access to only this particular Event Hub.
...
  output-kubernetes.conf: |
    [OUTPUT]
        Name                          kafka
        Alias                         logs_output
        Match                         kubernetes.logs.*
        Brokers                       ${FLUENT_BIT_EVENT_HUB_NAMESPACE}.servicebus.windows.net:9093
        Topics                        ${FLUENT_BIT_EVENT_HUB}
        Retry_Limit                   False
        Log_Level                     info
        Queue_Full_Retries            0
        Timestamp_Key                 @TimeGenerated
        Timestamp_Format              iso8601_ns
        Format                        json
        rdkafka.client.id             fluent-bit
        rdkafka.security.protocol     SASL_SSL
        rdkafka.sasl.mechanism        PLAIN
        rdkafka.sasl.username         $ConnectionString
        rdkafka.sasl.password         ${FLUENT_BIT_EVENT_HUB_CONNECTION_STRING}
        rdkafka.request.required.acks 1
        rdkafka.log.connection.close  false
        rdkafka.message.timeout.ms    0
One of the most important things when using Fluent Bit is to ensure that we do not lose any log data on the log collection side. Hence, the configuration parameters Retry_Limit, Queue_Full_Retries, and rdkafka.message.timeout.ms try to ensure that. Then we use some best practice configurations for the parameters rdkafka.request.required.acks and rdkafka.connection.close. The rdkafka.sasl.mechanism is set to PLAIN for using a connection string for authentication.
A full list of the rdkafka configuration parameters and Fluent Bit’s Kafka output plugin can be found under the following links.
-> https://github.com/confluentinc/librdkafka/blob/master/CONFIGURATION.md
-> https://docs.fluentbit.io/manual/pipeline/outputs/kafka
The required Kubernetes secret in our setup that provides the Event Hub Namespace name, the Event Hub name, and the connection string to Fluent Bit is created by running the following script that also deploys Fluent Bit.
❯ ./deploy-fluent-bit.sh RESOURCE_GROUP EVENT_HUB_NAMESPACE EVENT_HUB SHARED_ACCESS_POLICY_NAME
❯ ./deploy-fluent-bit.sh adx adxaks kubernetes fluent-bit
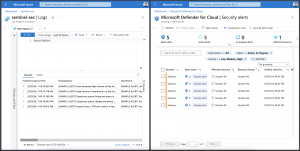
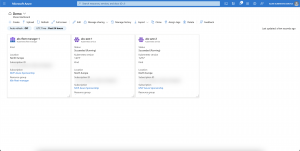
After a successful deployment of Fluent Bit, we should see the first container logs in Azure Data Explorer.
![Azure Data Explorer Container Logs]()
Summary
Fluent Bit supports several output plugins that can be used for data ingestion into Azure Data Explorer. The most suitable and versatile is from my current experience the Kafka output plugin with an Azure Event Hub. This option has some key advantages compared to the Azure Data Explorer and Azure Blob output plugin. First, we can use the streaming ingestion for near real-time ingestion compared to the queued ingestion method that the Azure Data Explorer output plugin uses. Second, it is cost-efficient compared to the Azure Blob output plugin which suffers in the end from the storage transaction costs in Azure.
So, my recommendation at the moment is the Kafka output plugin with an Azure Event Hub to ingest container logs via Fluent Bit into Azure Data Explorer.
Unfortunately, I had issues getting the Azure Data Explorer output plugin into a stable operation which would have been my preferred solution.
The example KQL file and the entire Fluent Bit deployment configuration can be found on my GitHub repository.
-> https://github.com/neumanndaniel/scripts/tree/main/Azure_Data_Explorer/Fluent_Bit_Kubernetes
-> https://github.com/neumanndaniel/kubernetes/tree/master/fluent-bit/azure-data-explorer